Band 5.0 IELTS Writing Task 1 Model Answer
Overall Band Score: 5.0 · Cambridge IELTS 18 · 2026-11-10
IELTS Writing Task 1 question
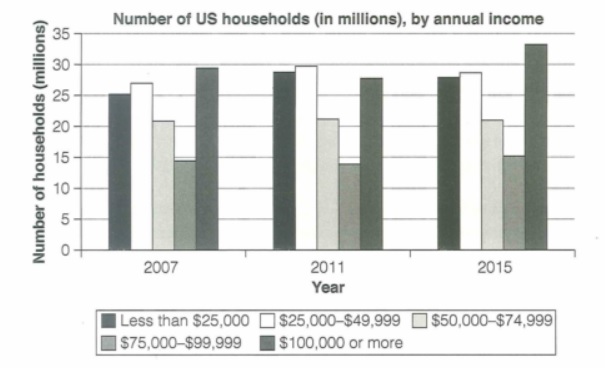
The chart below shows the number of households in the US by their annual income in 2007, 2011 and 2015.
Summarize the information by selecting and reporting the main features and make comparisons where relevant.
Student answer (Band 5.0)
The bar chart gives information about how many households in the US by their annual income in three different years.
It is clear that in 2015 annual income of the households was at most while in 2007 and 2007 annual income remained almost similar respectively.
In 2007, 25 millions households annual income was less than $25000 while in 2011 number of households increased and it was near 30 millions which was most in number. In the other hand,it was near 28 millions in 2015. Afterwards, in 2007 annual income was $25,000-$49,999 for almost 27 millions households whereas in 2011 the number of households rose significantly and it was almost 30 millions. Although annual income was similar, number of households increased slightly in 2015 than previous.
The number of households was almost 21 millions which was same for three distinct years and their annual income were less than $50,000-$74,999 . Afterwards, the number of households was down slightly and it was near 15 millions in 2007 and also in 2011 it was decresed almost a million but in 2015 it was 15 millions . In contrast, in 2015 number of households and their income rose significantly which was near 35 millions with $100,000 or more annual income while in 2007 it was almost 30 millions also in 2011 ,households numbers decreased slightly which was near 27 millions.
AI examiner evaluation
| Criterion | Band |
|---|---|
| Task Achievement / Task Response | 5.0 |
| Coherence and Cohesion | 4.5 |
| Lexical Resource | 5.5 |
| Grammatical Range and Accuracy | 5.0 |
| Overall | 5.0 |
Task Achievement / Task Response: Band 5.0
You cover all five income groups and include several relevant comparisons, such as the unchanged figure of about 21 million for the $50,000–$74,999 group and the rise in the $100,000-or-more group by 2015. However, the overview is unclear and contains a repeated year: “in 2015 … at most” does not identify which income category reached its peak, and “in 2007 and 2007” is inaccurate. Some figures and trends are also imprecise: the $25,000–$49,999 group was about 29.5 million in 2011 and 28.5 million in 2015, so it did not continue to increase. The comparison of the $75,000–$99,999 group is confusing. A clearer overview of the main contrasts, supported by accurate category-by-category reporting, would strengthen the response.
Coherence and Cohesion: Band 4.5
The response has a basic paragraph structure, and the body attempts to move through the income categories, which gives the reader some organisation. However, progression is difficult to follow because the overview is unclear and the categories are not consistently distinguished. For example, “The number of households was almost 21 millions” is followed by “their annual income were less than $50,000-$74,999,” making the category reference confusing. Linking phrases such as “Afterwards,” “Although,” and “In contrast” are sometimes used inaccurately or do not show the relationship between the figures. Grouping the categories into clearer paragraphs and using direct references such as “the $50,000–$74,999 bracket” would improve cohesion and make comparisons easier to track.
Lexical Resource: Band 5.5
You use some task-relevant vocabulary, including “increased,” “decreased,” “similar,” and “rose significantly,” and you attempt to describe changes rather than simply list figures. However, the range is limited and several word choices or collocations are awkward, sometimes making the intended meaning unclear. Phrases such as “annual income of the households was at most,” “most in number,” and “their income rose significantly” do not accurately express the number of households in each income bracket. There are also spelling errors, including “decresed.” Use precise chart language consistently—for example, describe the number of households in a bracket as rising, falling, or remaining stable—and check spelling and natural collocations.
Grammatical Range and Accuracy: Band 5.0
You attempt both simple and more complex sentences, including clauses beginning with “while” and “Although,” but complex structures are often faulty and errors occur frequently enough to make some sentences difficult to interpret. Examples include “25 millions households annual income was less than $25000,” where the noun phrase and agreement are not controlled, and “the number of households was same,” which is missing an article. In “their annual income were,” the subject and verb do not agree. Sentence boundaries and punctuation are also inconsistent, as in “In the other hand,it.” Practise building accurate comparison sentences with a clear subject, such as “The number of households in this bracket rose from … to …,” and check articles, plurals, agreement, and punctuation.
See this exact question answered at other band scores. The same prompt compared across bands.
Browse more IELTS Writing model answers or get your own writing scored by the same AI examiner.