Band 5.5 IELTS Writing Task 1 Model Answer
Overall Band Score: 5.5 · Cambridge IELTS 18 · 2026-11-11
IELTS Writing Task 1 question
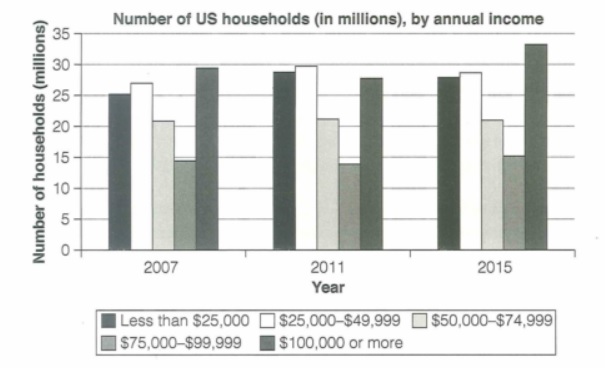
The chart below shows the number of households in the US by their annual income in 2007, 2011 and 2015.
Summarize the information by selecting and reporting the main features and make comparisons where relevant.
Student answer (Band 5.5)
The bar chart gives information about the number of households in US their annual income in 2007, 2011 and 2015
Overall, the number of households the highest income group the most end of the period whereas the middle income stayed at almost same in three years
In 2007 ,around 25 million households earned less than 25,000 dollar and about 26 million income between 50,000-49,999dollar but 14 million earned 75,000-99,999 dollars and the highest households income at 29 million noted 100,000 or more in 2007 while the number of households 28 million earned less than 25 , 000 dollar in 2011 and the 30 million income households at 25,000 - 49,000 but the lowest was 13 million earned 75, 000-99,999 in 2011 the number of households 27 million income 100,000 or more
Moving further , the highest was the number of households 27 million earned less than 25,000 dollar in 2015 and 28 million income 25,000-49,999 in 2015than the number of households 21 million earned at 50,000-74,999 . the highest was the number of households income 36 million 100,000 or more in 2015
AI examiner evaluation
| Criterion | Band |
|---|---|
| Task Achievement / Task Response | 5.5 |
| Coherence and Cohesion | 5.5 |
| Lexical Resource | 5.0 |
| Grammatical Range and Accuracy | 5.0 |
| Overall | 5.5 |
Task Achievement / Task Response: Band 5.5
You identify the chart’s subject and include an overview, noting that the highest-income group was largest at the end and that a middle-income category remained stable. You also report several relevant figures, such as about 25 million in the lowest-income group in 2007 and 21 million in the $50,000–$74,999 group. However, coverage is partial and some figures or labels are inaccurate: the $50,000–$74,999 figure in 2007 is about 21 million, not 26 million, and the 2015 lowest-income figure is about 28 million, not 27 million. The overview could identify the 2011 peak in several lower-income categories and the rise in the $100,000-or-more group by 2015. More accurate, selective comparisons would strengthen the report.
Coherence and Cohesion: Band 5.5
The response has a basic structure: an introduction, an overview, and paragraphs covering the three years. This gives the reader some sense of how the report is organised. However, progression within the body is difficult to follow because many figures are joined in long, loosely connected sentences, especially the paragraph beginning “In 2007” and continuing through 2011. The transitions “while” and “Moving further” do not always make the relationships between categories clear, and the repeated “the number of households” creates a list-like effect. Grouping the income bands by trend—for example, stable categories versus those that rose or fell—and using shorter comparison sentences would make the information easier to track.
Lexical Resource: Band 5.0
You use relevant task vocabulary, including “bar chart,” “income group,” and “middle income,” and you attempt to describe comparisons and changes. However, the range is limited, and several phrases are awkward or unclear, such as “the number of households the highest income group the most” and “the highest was the number of households.” These make it harder to understand what is being compared. Some income-band labels are also written inconsistently, which affects precision. Use a wider set of accurate reporting expressions, such as “stood at,” “rose to,” “remained stable,” and “the largest category,” while keeping the income ranges exact. This would make the description clearer and more natural without requiring elaborate vocabulary.
Grammatical Range and Accuracy: Band 5.0
You attempt longer sentences and use some linking structures, but the response relies heavily on extended sentences that are often difficult to parse. For example, “the number of households 28 million earned less than…” lacks a clear grammatical relationship between the subject and figure, while the overview sentence “the number of households the highest income group the most end of the period” is incomplete. Articles, prepositions, and sentence boundaries are also frequently missing or misplaced, as in “households in US their annual income.” These errors can make comparisons unclear. Practise building complete sentences with a clear subject and verb, such as “The number of households earning under $25,000 rose to about 28 million in 2011,” and use full stops to separate distinct data points.
See this exact question answered at other band scores. The same prompt compared across bands.
Browse more IELTS Writing model answers or get your own writing scored by the same AI examiner.