Band 5.5 IELTS Writing Task 1 Model Answer
Overall Band Score: 5.5 · Cambridge IELTS 18 · 2026-11-11
IELTS Writing Task 1 question
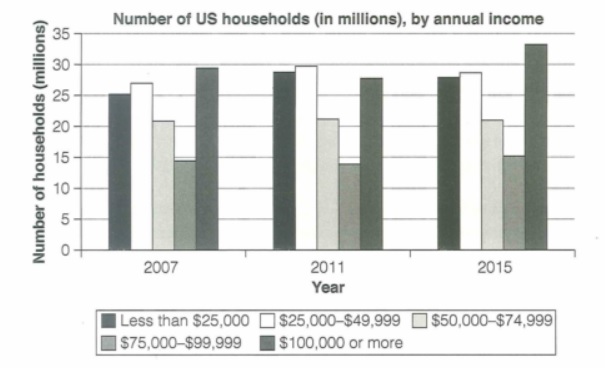
The chart below shows the number of households in the US by their annual income in 2007, 2011 and 2015.
Summarize the information by selecting and reporting the main features and make comparisons where relevant.
Student answer (Band 5.5)
The given bar chart illustrates that how many people of US are housholds by their earn during 2007, 2011 and 2015.
Overall, the given bar chart described about the households of US regarding to their annual income in different years.
Firstly, in 2007, there are 25 millions of US people are households whos income is less than 25000, and 27 millions of between 25000 to 49999, and 20 millions of between 50000 to 74999, only 13 millions of between 75000 to 99999 and upto 29 millions of between [redacted phone] or more than it.
Secondly, in 2011, the number of households of all categories were increased except of more then [redacted phone] income of people per year, like the range of income of people of 25000 increased from 25 to 28 millions like other, but the last one is decreased from 29 millions to 27 millions. Moreover in 2015 the segnaficant increased were seen in the income of more than [redacted phone], like they increased from 28 millions to 33 millions which is highest amoung all of other, but oyher not changed too much.
AI examiner evaluation
| Criterion | Band |
|---|---|
| Task Achievement / Task Response | 5.5 |
| Coherence and Cohesion | 5.5 |
| Lexical Resource | 5.0 |
| Grammatical Range and Accuracy | 5.0 |
| Overall | 5.5 |
Task Achievement / Task Response: Band 5.5
You identify the chart’s subject and include figures for all three years, with relevant comparisons such as the rise in the $100,000-or-more group by 2015. However, the overview mostly repeats that the chart concerns household income rather than summarising its main patterns. Some figures and trends are inaccurate: the $50,000–$74,999 group is about 21 million throughout, not 20 million in 2007, and the $75,000–$99,999 group falls slightly in 2011 before rising to about 15 million in 2015. The claim that all categories except the highest-income group increased in 2011 is also incorrect, since the middle-income group stayed level and the $75,000–$99,999 group dipped. Select the clearest overall trends and report them accurately.
Coherence and Cohesion: Band 5.5
The response has a basic paragraph structure, and the sequence from 2007 to 2011 and then 2015 gives the reader a general chronological route through the data. However, the opening and overview repeat the same broad point, so the progression is not clear from the start. The connectors “Firstly,” “Secondly,” and “Moreover” signal stages, but they do not always make the relationships between comparisons clear; the long 2011 sentence, for example, combines a general claim with examples that do not fully support it. Grouping the figures by notable trends—such as the stable middle-income category and the rise in the highest bracket—would create a clearer progression. Use shorter, more focused sentences and make comparisons explicit.
Lexical Resource: Band 5.0
You use some task-relevant terms, including “bar chart,” “annual income,” “categories,” and “increased,” so the reader can recognise the topic and basic trends. However, the range is limited and several word choices or collocations make the description awkward, such as “people of US are housholds,” “income of people per year,” and “the significant increased were seen.” Spelling errors including “segnaficant,” “amoung,” and “oyher” also reduce clarity. Use the chart’s precise vocabulary consistently: it counts households, not people, and income groups can be called “brackets” or “ranges.” Practise accurate forms such as “a significant increase” and “the highest figure” to describe changes more naturally.
Grammatical Range and Accuracy: Band 5.0
You attempt both simple statements and longer sentences with clauses, but the longer constructions are often difficult to follow because of frequent errors. For example, “The given bar chart illustrates that how many…” has an unnecessary “that” and an incorrect question-like structure; “there are 25 millions … are households” also has faulty sentence structure and agreement. Tense and number forms are inconsistent, as in “in 2007, there are” and “25 millions.” Articles and prepositions are also often missing or misplaced. These errors sometimes make the intended comparison unclear. Build accuracy first with a clear pattern such as “There were about 25 million households earning less than $25,000,” then add a second clause only when its relationship is clear.
See this exact question answered at other band scores. The same prompt compared across bands.
Browse more IELTS Writing model answers or get your own writing scored by the same AI examiner.