Band 5.0 IELTS Writing Task 1 Model Answer
Overall Band Score: 5.0 · Cambridge IELTS 18 · 2026-11-11
IELTS Writing Task 1 question
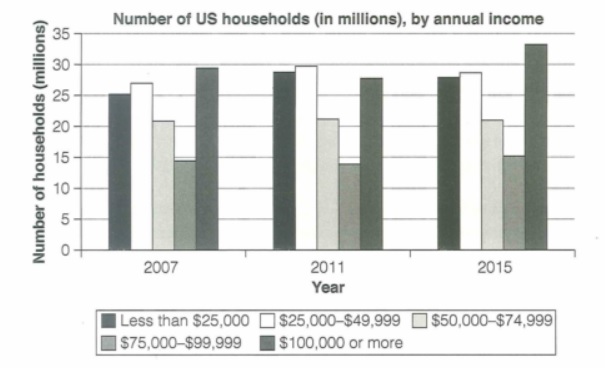
The chart below shows the number of households in the US by their annual income in 2007, 2011 and 2015.
Summarize the information by selecting and reporting the main features and make comparisons where relevant.
Student answer (Band 5.0)
The bar chart illustrates residents in millions in the united states by their yearly earning in five categories 2007, 2011 and 2015. overall, income was falctuated from the begining except third categories was remain same in all years and the number high income residents are at peak in last.
in contrast, about 21 million households annual income from $50,000-$74,999 are remain unchanged in all years, however the residents who earn more than $100,000 or more are nearly 30 million in 2007 but they fall upto 27 million in 2011 but they are 33 million in 2015 which is the peak in chart and people earn less than $25,000 are 25 million in 2007 but they rose upto 29 million in 2011 and in 2015 they fell nearly 27 million.
however, people earn between $25,000-$49,999 are 26 million in 2007 and rise upto 30 million in 2011 but fell upto 28 million in 2015 but people earn be
AI examiner evaluation
| Criterion | Band |
|---|---|
| Task Achievement / Task Response | 5.0 |
| Coherence and Cohesion | 4.0 |
| Lexical Resource | 5.0 |
| Grammatical Range and Accuracy | 5.0 |
| Overall | 5.0 |
Task Achievement / Task Response: Band 5.0
You identify several relevant patterns, including the unchanged figure of about 21 million in the $50,000–$74,999 group and the rise in households earning at least $100,000 by 2015. However, the overview is unclear and partly inaccurate: “income was fluctuated” does not clearly summarise the main trends, and the claim that the third category “remain same” is not enough to describe the chart as a whole. Some figures are also imprecise, such as reporting 26 million for the $25,000–$49,999 group in 2007, which is closer to 27 million. The final sentence is unfinished, leaving the $75,000–$99,999 category unreported. Select the main comparisons and give a complete, accurate overview before supporting it with figures.
Coherence and Cohesion: Band 4.0
The response has some paragraphing and attempts to group figures by income category, so the reader can follow parts of the comparison. However, the progression is difficult to track: the overview is followed by a paragraph beginning “in contrast,” then another beginning “however,” without a clear reason for these shifts. The final paragraph stops at “but people earn be,” which breaks the flow and leaves the comparison incomplete. Linking words are repeated and sometimes do not express the relationship between ideas accurately. Organise the response into a clear introduction, overview, and two data-focused paragraphs, and use transitions only where they clarify a contrast or continuation.
Lexical Resource: Band 5.0
You use some relevant chart vocabulary, including “bar chart,” “categories,” “unchanged,” “rose,” and “fell,” and the income bands are generally identifiable. However, the range is limited and several word choices or collocations are inaccurate, such as “residents” for households, “yearly earning,” and “income was falctuated.” Spelling errors such as “begining” and “falctuated” also reduce clarity. Repetition of “people earn” makes the description less precise. Use the chart’s unit consistently—“households”—and practise standard trend language such as “the number increased,” “remained stable,” and “reached a peak.”
Grammatical Range and Accuracy: Band 5.0
You attempt longer sentences with contrast, for example using “but” and “however,” but these structures are often faulty, and the range of sentence patterns remains limited. Errors in verb forms and agreement occur throughout: “are remain unchanged,” “they fall upto,” and “they rose upto” do not use tense consistently. The opening also lacks clear sentence boundaries and appropriate capitalisation, while “in all years” is awkwardly placed in its sentence. These errors sometimes make relationships between figures harder to understand. Build accurate simple sentences first, then combine them with controlled clauses, checking subject–verb agreement, past-tense forms, articles, and punctuation.
See this exact question answered at other band scores. The same prompt compared across bands.
Browse more IELTS Writing model answers or get your own writing scored by the same AI examiner.