Band 5.0 IELTS Writing Task 1 Model Answer
Overall Band Score: 5.0 · Cambridge IELTS 18 · 2026-11-12
IELTS Writing Task 1 question
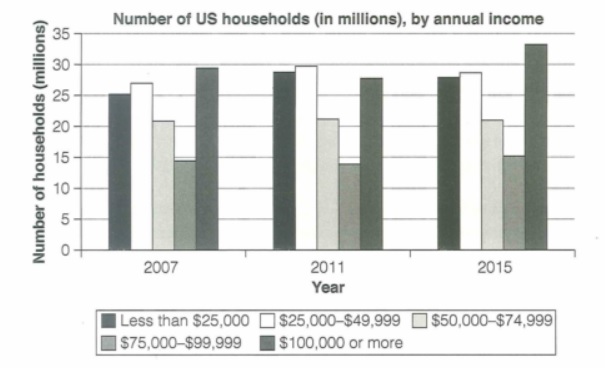
The chart below shows the number of households in the US by their annual income in 2007, 2011 and 2015.
Summarize the information by selecting and reporting the main features and make comparisons where relevant.
Student answer (Band 5.0)
The bar chart demonstrates the number of famillies and there income per annum between 2007 to 2015 in the USA.
Overall, In 2015 the maximum famillies have high income per annum which was upto 100k dollars, moreover in 2011 the maximum houses homes have income between 25-49k dollars and in 2007 the it was less than 25k dollars per year.
If we take a look on the graph in 2007 the maximum people earn less compare to the 2011 and 2015, however there annual income was around 25 k dollars of approximately 30 million famillies. In 2007 some people earn more which was 25 to 14 million families which earn more. In 2011 approximately 30 million households earn 25 to 49 k dollars per year which was progress compared to 2007 but some earn around less than 25 k dollars per year which placed in second.
In 2015 most of the famillies earned more money annually if compared to the year 2011 and 2007, furthermore in 2015 upto 33 million famillies earned more than 100k dollars per years followed by 25 to 49 k earning famillies which were arround 27 k and the remaining famillies was random earnings per year.
AI examiner evaluation
| Criterion | Band |
|---|---|
| Task Achievement / Task Response | 5.0 |
| Coherence and Cohesion | 5.5 |
| Lexical Resource | 5.0 |
| Grammatical Range and Accuracy | 5.0 |
| Overall | 5.0 |
Task Achievement / Task Response: Band 5.0
You identify the chart’s broad subject and include a useful overview: the $100,000-or-more group is highest in 2015, while the $25,000–$49,999 group leads in 2011. However, the overview misstates 2007: the largest group was households earning $100,000 or more, at about 29.5 million, not those earning less than $25,000. Several details are also unclear or inaccurate, such as saying that around 30 million families earned less than $25,000 in 2007 and describing the remaining 2015 figures as “random.” The response therefore reports some relevant features but only partially covers the main comparisons. Select the largest and smallest categories in each year, then support the overview with accurate figures and clear trends.
Coherence and Cohesion: Band 5.5
The response has a basic structure, moving from an introduction and overview to details about 2007, 2011 and 2015. This gives the reader some sense of the chart’s time sequence. However, progression within the body is difficult to follow: the sentence beginning “In 2007 some people earn more” does not clearly identify which income group or what comparison is being made, and “the remaining families was random earnings” does not explain the data. Linking words such as “however” and “furthermore” are used, but they do not always express a clear relationship between ideas. Organise the details by comparing the income groups across years, and use precise references such as “this category” only when the category is unmistakable.
Lexical Resource: Band 5.0
You use some relevant chart vocabulary, including “annual income,” “households,” “approximately” and “followed by,” so the topic is generally recognisable. However, the range is limited and several word choices or collocations make the meaning unclear. “Maximum families” and “maximum houses homes” are not natural ways to describe the largest category, while “people earn less” shifts from households to individuals. Repetition of “families” and “earn” also limits precision, and spelling errors such as “famillies” and “arround” are noticeable. Use consistent chart terminology and accurate income-group labels; for example, describe a category as “the largest group of households” and use “earned” or “had an annual income of” for the figures.
Grammatical Range and Accuracy: Band 5.0
You attempt longer sentences with clauses linked by “however,” “moreover” and “if compared,” but complex sentences are often faulty, and errors sometimes make relationships hard to understand. Examples include “the maximum families have high income,” “the maximum houses homes have income,” and “the remaining families was,” where agreement and sentence construction are not controlled. Tense and comparison patterns are also inconsistent, as in “people earn less compare to the 2011.” Some punctuation and capitalisation are inaccurate, including the capital letter after “Overall,” and the long sentences would benefit from clearer boundaries. Practise accurate simple comparison sentences first, then combine them using controlled clauses and consistent past-tense forms.
See this exact question answered at other band scores. The same prompt compared across bands.
Browse more IELTS Writing model answers or get your own writing scored by the same AI examiner.