Band 5.5 IELTS Writing Task 1 Model Answer
Overall Band Score: 5.5 · Cambridge IELTS 18 · 2026-11-12
IELTS Writing Task 1 question
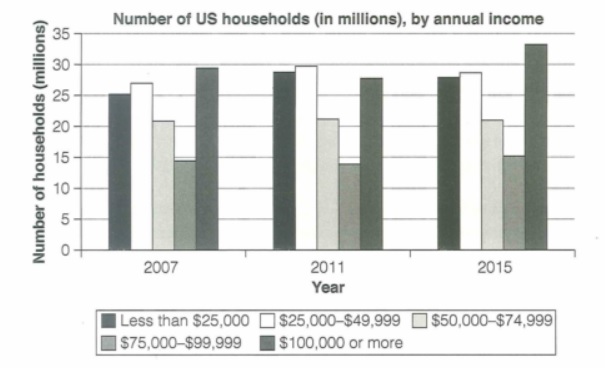
The chart below shows the number of households in the US by their annual income in 2007, 2011 and 2015.
Summarize the information by selecting and reporting the main features and make comparisons where relevant.
Student answer (Band 5.5)
The chart below gives information about household figures from the US by their yearly income in three years 2007, 2011, and 2015. It shows a fluctuation in the numbers but the smallest number is is presented as a gray bar and the biggest among all is shown on the chart as dark gray bar among the three years.
In the year 2007 , the number of households with an income of less than 25,000 was 26 ,those with 25,000 to 49,999 were 26 ,with 50,000 to 74,999 were 21 and from 75,000 to 99,999 were 14. While the highest were those with 100,000 and more.
Additionally, the same order of annual income was found in 2011 but with different figures. Those were 29, 30, 22, 13, and 27 respectively. This time the highest was households from 25,000 to 49,999.
Furthermore the year 2015 showed the exact arrangement as above differing only in numbers of houses. These are 27, 28, 21, 15 and the highest among all is 34.
AI examiner evaluation
| Criterion | Band |
|---|---|
| Task Achievement / Task Response | 4.5 |
| Coherence and Cohesion | 6.0 |
| Lexical Resource | 5.5 |
| Grammatical Range and Accuracy | 5.5 |
| Overall | 5.5 |
Task Achievement / Task Response: Band 4.5
You identify the three years and report several figures for each income group, so the response is relevant to the chart. However, the main features are not clearly summarised: there is no effective overview of the overall pattern, and the opening comments about grey bars do not explain the data. Some figures are inaccurate: for example, the chart shows about 25 million households below $25,000 in 2007, not 26; the $25,000–$49,999 group was about 27 million, not 26; and in 2011 the $50,000–$74,999 group remained near 21 million, not 22. The 2015 figures are also incomplete, with no value given for the $75,000–$99,999 group. Highlight the stable middle-income category and the rise in households earning $100,000 or more by 2015.
Coherence and Cohesion: Band 6.0
The response has a clear chronological structure: it moves from 2007 to 2011 and then 2015, with separate paragraphs for each year. Linking expressions such as “Additionally” and “Furthermore” help signal this progression. However, the organisation is largely a list of figures rather than a comparison of the chart’s main patterns, and the opening paragraph does not establish a useful overview. Phrases such as “the same order … was found in 2011” and “the exact arrangement as above” are unclear because the ranking changes between years. Improve progression by grouping related trends—for example, compare the stable $50,000–$74,999 category across all years, then describe the changing highest-income group—and use references that make the comparisons explicit.
Lexical Resource: Band 5.5
You use relevant chart vocabulary, including “households,” “annual income,” “figures,” and “highest,” and the income bands are generally identifiable. The range is nevertheless limited, with repeated wording such as “number,” “those,” and “different figures.” Some expressions are imprecise or unnatural: “household figures from the US” and “numbers of houses” do not accurately describe the number of households, while “exact arrangement” is not a clear way to describe the data. The reference to bars being “gray” and “dark gray” adds little analytical vocabulary. Use precise terms for quantities and trends, such as “the number of households,” “remained stable,” “rose,” and “declined,” and vary comparison language to make the report more concise and accurate.
Grammatical Range and Accuracy: Band 5.5
You attempt both simple and more complex forms, including “Those with … were …” and the contrast introduced by “While.” The meaning is usually recoverable, but some sentence structures are incomplete or awkward. For instance, “While the highest were those with 100,000 and more” is a dependent clause without a main clause, and “Furthermore the year 2015 showed … differing only in numbers” has an unclear construction. There are also punctuation and spacing problems, such as the space before the comma in “2007 ,” and missing spaces after commas. The opening sentence contains the repeated “is is.” Aim for complete sentences, especially when using “while,” and check articles, clause structure, and punctuation. More accurate complex sentences would help express comparisons clearly.
See this exact question answered at other band scores. The same prompt compared across bands.
Browse more IELTS Writing model answers or get your own writing scored by the same AI examiner.