Band 4.0 IELTS Writing Task 1 Model Answer
Overall Band Score: 4.0 · Cambridge IELTS 18 · 2026-11-12
IELTS Writing Task 1 question
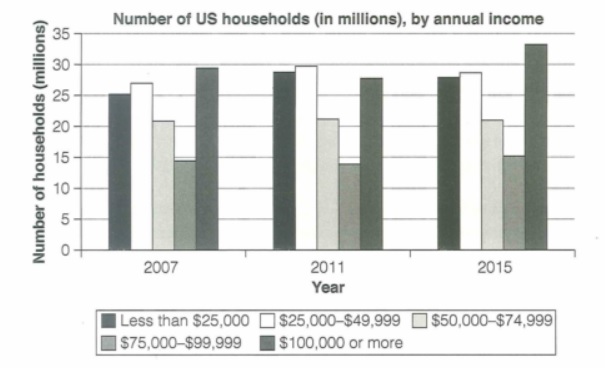
The chart below shows the number of households in the US by their annual income in 2007, 2011 and 2015.
Summarize the information by selecting and reporting the main features and make comparisons where relevant.
Student answer (Band 4.0)
The chart illustrates the figures of households in us by their annual earnings in 2007 , 2011 and 2015. this chart showed earnings od american people in 2007 , 2011 and 2015 in maximum 35 millions and in which highest earnings in millions hited more than 10 million of 33 million household number in 2015 their amount targeted highest in figures .
lowest earnings in 2011 hited half of quater of households and this eaernings contains 75 to 99 thousands dollors furthermorev this ratio same in 2007 and 2015 this figures almost same earnings and 50 to 74 thousand dollors this figures same in 2007 and 2011 and 2015
the less than 25 thousand dollors was same in 2011 and 2015 which almost one quarters millions households in america and 25 to 50 thousand dollors was same in all era which one
AI examiner evaluation
| Criterion | Band |
|---|---|
| Task Achievement / Task Response | 3.5 |
| Coherence and Cohesion | 4.0 |
| Lexical Resource | 4.5 |
| Grammatical Range and Accuracy | 4.5 |
| Overall | 4.0 |
Task Achievement / Task Response: Band 3.5
You identify the chart’s subject and refer to several income groups, including the $75,000–$99,999 and $50,000–$74,999 bands. However, the response does not provide a clear overview of the main trends, and several comparisons are inaccurate or unclear. For example, the $25,000–$49,999 group was not “same in all era”: it rose from about 27 million in 2007 to 29.5 million in 2011, then fell slightly. The $75,000–$99,999 group was also not the same across all years. The highest-income group reached about 33.5 million in 2015, a useful feature, but its trend is not explained. The response is also 8 words below the required minimum. Select the key trends accurately and support them with clear comparisons.
Coherence and Cohesion: Band 4.0
There is an attempt to organise the response into paragraphs and to connect information with words such as “furthermore” and “which.” However, the ideas do not progress in a clear sequence: the opening moves between the chart’s scale, the highest income group and an unclear statement about earnings, while the next paragraph shifts among several categories without a consistent comparison. The final sentence is incomplete, ending with “which one,” so the reader cannot understand the intended point. Use a clear structure: introduction, overview, then one or two paragraphs comparing related income groups. Make each sentence express one complete comparison, and use linking words only when the relationship between ideas is clear.
Lexical Resource: Band 4.5
You use some relevant vocabulary for describing the chart, including “households,” “annual earnings,” “highest” and “lowest,” so the topic is recognisable. However, word choice and spelling are often inaccurate or repetitive, and some phrases make the data difficult to understand. For instance, “earnings hited” and “their amount targeted highest in figures” do not communicate a clear trend; “ratio” is also not the right term for the number of households. There are frequent spelling errors such as “dollors,” “eaernings” and “furthermorev.” Use standard chart language such as “rose,” “fell,” “remained stable,” “income bracket” and “approximately.” Check spelling and choose precise terms for counts rather than ratios.
Grammatical Range and Accuracy: Band 4.5
The response attempts both simple and longer sentence forms, but control is inconsistent, and several sentences are difficult to follow. For example, “this chart showed earnings od american people” has problems with capitalization, verb choice and sentence construction, while “the less than 25 thousand dollors was same in 2011 and 2015” has an agreement error and an incomplete comparison. The final clause, “which one,” is unfinished. Most statements would be clearer if written as complete sentences with a subject and a correctly formed verb, such as “The number of households earning under $25,000 rose in 2011 and then remained almost unchanged in 2015.” Practise accurate past-tense reporting, articles, plurals and sentence boundaries before attempting longer structures.
See this exact question answered at other band scores. The same prompt compared across bands.
Browse more IELTS Writing model answers or get your own writing scored by the same AI examiner.