Band 4.0 IELTS Writing Task 1 Model Answer
Overall Band Score: 4.0 · Cambridge IELTS 18 · 2026-11-15
IELTS Writing Task 1 question
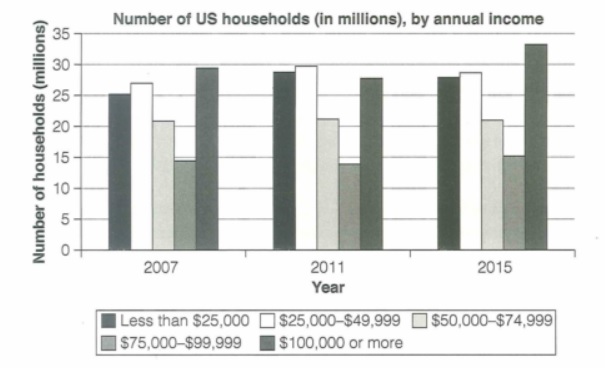
The chart below shows the number of households in the US by their annual income in 2007, 2011 and 2015.
Summarize the information by selecting and reporting the main features and make comparisons where relevant.
Student answer (Band 4.0)
The bar chart below illustrates the number of households in the US by their yearly earnings in year 2007,2011, and 2015 and by comparing them.
Overall, the chart shows the number of household were the highest number of households in 2015; meanwhile in 2007 the number of households were the
AI examiner evaluation
| Criterion | Band |
|---|---|
| Task Achievement / Task Response | 2.5 |
| Coherence and Cohesion | 3.5 |
| Lexical Resource | 4.5 |
| Grammatical Range and Accuracy | 4.5 |
| Overall | 4.0 |
Task Achievement / Task Response: Band 2.5
The response identifies the chart’s subject and attempts an overview, but it does not provide a usable summary of the data. The statement that household numbers were highest in 2015 is too broad: the chart shows different patterns across income groups, with the $100,000-or-more group reaching its peak in 2015, while the $50,000–$74,999 group stays level. The comparison about 2007 is left unfinished, and no figures or meaningful category comparisons are reported. The response is also far below the required 150 words, with 41 words submitted; this leaves the task substantially incomplete. To improve, complete the overview and select key trends and comparisons from the chart, supporting them with approximate figures.
Coherence and Cohesion: Band 3.5
There is a basic attempt to organise the response: an opening sentence introduces the chart, followed by a separate overview beginning with “Overall”. This gives the reader a simple starting structure. However, the response ends mid-sentence (“in 2007 the number of households were the”), so the main idea is not completed and there is no progression into supporting details. The opening also repeats the idea of comparison without actually presenting one. Develop a clear sequence: introduce the chart, summarise the main patterns, then compare selected income groups across the years. Use linking expressions only where they clarify relationships, and ensure every sentence is complete.
Lexical Resource: Band 4.5
The vocabulary is sufficient to identify the topic, using relevant terms such as “bar chart”, “households”, and “yearly earnings”. The wording is generally understandable, but the range is narrow and some expressions are repetitive or imprecise: “number of households” appears several times, while “by comparing them” does not clearly explain what is being compared. For a chart summary, use more precise terms for the data and its movement, such as “income bracket”, “figure”, “rose”, “remained stable”, and “reached a peak”. Also prefer the more formal phrase “annual income” to “yearly earnings” in this context. Greater variety and accuracy would make the description clearer and more academic.
Grammatical Range and Accuracy: Band 4.5
The response attempts a longer sentence with “Overall” and “meanwhile”, and the opening communicates the general subject. However, grammatical control is uneven. In “the number of household were the highest number of households”, the singular subject “number” does not agree with “were”, and the construction is repetitive and incomplete in meaning. The final clause, “in 2007 the number of households were the”, is unfinished, so the reader cannot understand the intended comparison. The opening also needs clearer punctuation around the list of years. Practise writing complete, controlled sentences with accurate subject–verb agreement, then add a second sentence to report a specific trend.
See this exact question answered at other band scores. The same prompt compared across bands.
Browse more IELTS Writing model answers or get your own writing scored by the same AI examiner.