Band 4.5 IELTS Writing Task 1 Model Answer
Overall Band Score: 4.5 · Cambridge IELTS 18 · 2026-11-16
IELTS Writing Task 1 question
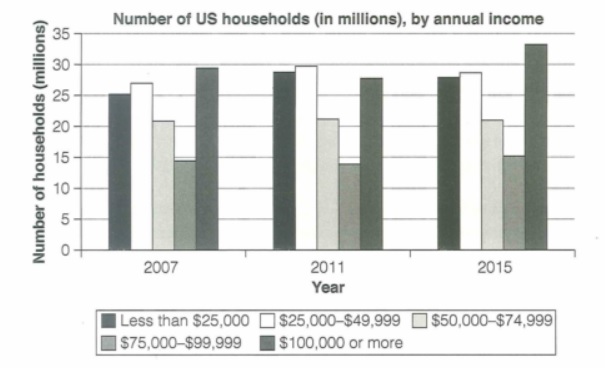
The chart below shows the number of households in the US by their annual income in 2007, 2011 and 2015.
Summarize the information by selecting and reporting the main features and make comparisons where relevant.
Student answer (Band 4.5)
The bar chart provides information the number of households in the Us by thier yearly income in 2007, and 2011 and 2015. It compares different categories and shows how the figures changed during the given period.
Overall, it is clear that US household recorded highest figures who less than 25000 dollars annual income in 2015 , followed by the 14 millions household recorded the lowest figures who ear income 75000 to 99999 dollars anually . It is also noticable that thier were the significant difference between the figures.
Look at the first category 25 millions households had less less than 25000 income yeraly, followed by the 25000 to 49999 was 27 millions and 50000 to 74999 were 21 millions people , also [redacted phone] or more recorded highest figure aproximately around 29 millions citizen in 2007.
Furthermore less than 25000 was 38 millions, less than 49999 to 25000 was highest number 39 millions and also 75000 to 49999 were around 13 millions people in 2011 . in addition less than 25000 recorded highest figure around 33 millions in 2015. these information show the changes and differ
AI examiner evaluation
| Criterion | Band |
|---|---|
| Task Achievement / Task Response | 4.0 |
| Coherence and Cohesion | 5.0 |
| Lexical Resource | 5.0 |
| Grammatical Range and Accuracy | 4.5 |
| Overall | 4.5 |
Task Achievement / Task Response: Band 4.0
The response identifies the chart’s subject and attempts to compare the three years, but it reports several central figures inaccurately, which makes the account only minimally effective. For example, the 2011 figures of 38 and 39 million are not supported by the chart; the two lower-income groups were about 28.5 and 29.5 million. The claim that the under-$25,000 group was highest in 2015 is also incorrect: households earning $100,000 or more reached the chart’s peak, at about 33.5 million. The overview also calls the under-$75,000 group the lowest, although the $75,000–$99,999 category was lowest. To improve, select the main trends accurately and give a clear overview before supporting it with reliable comparisons.
Coherence and Cohesion: Band 5.0
There is some organisation: an introduction is followed by an overview and then details for 2007 and 2011–2015. Basic linking phrases such as “Overall,” “Furthermore,” and “in addition” show an attempt to connect ideas. However, progression is difficult to follow because the final paragraph combines several categories and years without a consistent order, and it ends with the incomplete phrase “these information show the changes and differ.” References such as “the first category” and “these information” are not sufficiently clear. Organise the body by year or by income group, and use one sentence per clear comparison; this would make the sequence easier to follow and reduce the need for repeated connectors.
Lexical Resource: Band 5.0
The response uses some task-related vocabulary, including “households,” “annual income,” “categories,” and “figures,” so the topic is generally recognisable. However, the range is limited and several word choices or collocations make the meaning awkward: “household recorded highest figures,” “people” and “citizen” for household counts, and “significant difference” without specifying the comparison. Spelling errors such as “thier,” “anually,” and “noticable” also reduce accuracy. Use precise chart language consistently—for example, “the number of households,” “income bracket,” “rose to,” and “remained stable”—and check spelling and the natural pairing of words before submitting.
Grammatical Range and Accuracy: Band 4.5
The response attempts both simple and longer sentences, but control is weak and errors frequently make relationships between figures unclear. For instance, “US household recorded highest figures who less than 25000 dollars annual income” lacks a clear grammatical structure, while “less than 25000 was 38 millions” does not clearly identify what the number represents. There are also problems with articles, agreement, plurals, and punctuation, as in “these information show” and the inconsistent spacing around commas. Build accurate simple sentences first, such as “There were about 25 million households in this bracket in 2007,” then combine comparisons using controlled clauses. Check that each sentence has a clear subject and verb.
See this exact question answered at other band scores. The same prompt compared across bands.
Browse more IELTS Writing model answers or get your own writing scored by the same AI examiner.