Band 4.5 IELTS Writing Task 1 Model Answer
Overall Band Score: 4.5 · Cambridge IELTS 18 · 2026-11-16
IELTS Writing Task 1 question
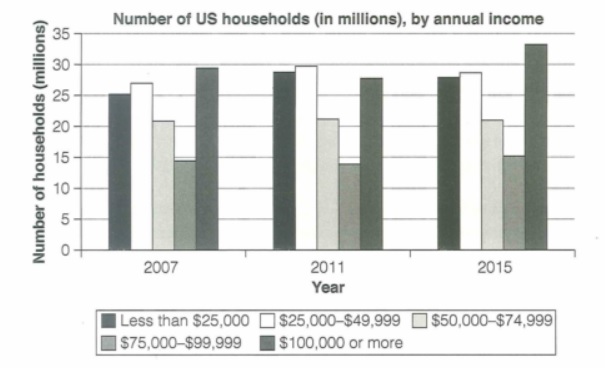
The chart below shows the number of households in the US by their annual income in 2007, 2011 and 2015.
Summarize the information by selecting and reporting the main features and make comparisons where relevant.
Student answer (Band 4.5)
The chart graph illustrate the number of households in the US by their usual income between 2007,2011 and 2015. This figure measured in millions.
Overall,numbers of households by annual income in 2007 increase around 29 million ,whereas numbers of households increased approxmately 33 millions in 2015.
In 2007,numbers of households starting with 25 million and increased 27 million then decreased 21 millions.The annual income declined 13 millions 2007 and rose up 29 millions. In 2011,to being with 28 million and increased 30 million.After time spend ,gradully decreased in 21 million and badly decreased 14 million.
In 2015,starting with 28 million and increased 29 million. 20 million gradully declined 15 million and weak performance in 10 million.after that ,in 2015 increased approxmitaley 34 million rise as compared to 2007 and 2011.the result is the annual income by number of households increased in 2015.
AI examiner evaluation
| Criterion | Band |
|---|---|
| Task Achievement / Task Response | 4.0 |
| Coherence and Cohesion | 5.0 |
| Lexical Resource | 5.0 |
| Grammatical Range and Accuracy | 4.5 |
| Overall | 4.5 |
Task Achievement / Task Response: Band 4.0
The response identifies the chart’s subject and includes an overview suggesting that the highest figure was around 29 million in 2007 and that the peak was about 33 million in 2015. However, the overview is incomplete and some comparisons are inaccurate or unclear: the 2015 figure of about 33.5 million belongs to the $100,000-or-more group, while the 2007 peak was also in that group at about 29.5 million. Several figures and trends are misreported, including the $75,000–$99,999 group, which was about 14–15 million rather than 13 million in 2007. The response is also 17 words below the 150-word minimum. To improve, identify the five income bands clearly and summarise their main changes accurately.
Coherence and Cohesion: Band 5.0
There is some organisation: the response moves from an introduction and overview to separate descriptions of 2007, 2011 and 2015. This gives the reader a basic framework. However, the year-by-year sequence does not make comparisons between income groups easy to follow, and several transitions are unclear, as in “After time spend” and “after that.” The repeated pattern of “starting with” and “increased” also makes the account feel list-like rather than progressively organised. Grouping the figures by their trends—for example, the broadly stable middle-income band and the changing highest-income band—would create a clearer progression. Use linking phrases to show contrasts and stability, and make sure each sentence clearly identifies the income category being discussed.
Lexical Resource: Band 5.0
The response uses some relevant chart vocabulary, including “number of households,” “annual income,” “increased,” and “decreased,” so the topic is generally recognisable. However, the range is limited and several choices are inaccurate or awkward, which sometimes makes the intended trend difficult to understand. For example, “badly decreased” is not a suitable way to describe a numerical change, and “weak performance” is inappropriate for a household count. There are also spelling errors such as “approxmately,” “gradully,” and “approxmitaley.” Aim for precise, neutral reporting language and vary the verbs only when the data supports the distinction. Check spelling carefully, especially for repeated key terms.
Grammatical Range and Accuracy: Band 4.5
The response attempts both simple statements and longer sentences, but control is inconsistent and errors sometimes obscure the relationships between figures. Examples include “The chart graph illustrate,” where the subject and verb do not agree, and “numbers of households starting with 25 million,” which lacks a clear finite verb and a complete grammatical structure. Articles, plurals and sentence boundaries are also problematic, as in “increased approxmately 33 millions in 2015” and the run-on sequence beginning “20 million gradully declined.” Use a clear pattern such as “The number of households earning under $25,000 rose from X to Y,” and check agreement, verb tense, articles and punctuation. More accurate complete sentences would make the data easier to interpret.
See this exact question answered at other band scores. The same prompt compared across bands.
Browse more IELTS Writing model answers or get your own writing scored by the same AI examiner.