Band 5.0 IELTS Writing Task 1 Model Answer
Overall Band Score: 5.0 · Cambridge IELTS 18 · 2026-11-16
IELTS Writing Task 1 question
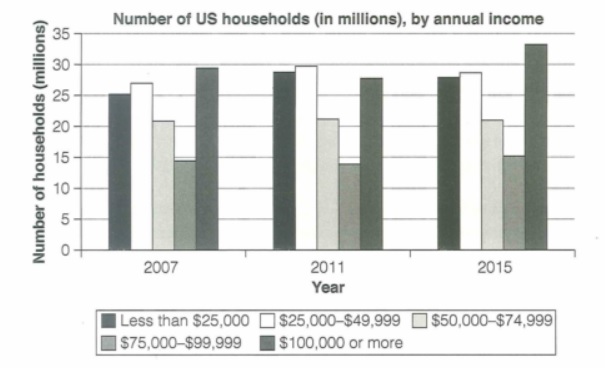
The chart below shows the number of households in the US by their annual income in 2007, 2011 and 2015.
Summarize the information by selecting and reporting the main features and make comparisons where relevant.
Student answer (Band 5.0)
The bar chart illustrates the count of households in millions in the US by their yearly income in 2007,2011 and 2015.
Overall, there are five number of groups with different earnings are shown in the graph.It can be easily seen that number of households for people having highest income are more than any other.While, people with less salary than thse are most likey to have lowest number of housechores.
It is evident that in 2007 group whose is considered the most elit one with [redacted phone] or more earning among these also has a large amount of households which is about 30 and about 35 in 2015 Then people with 25million to 49.999 million were taking the 2nd sport with more than 25, 30 and then decilne slightly in 2007,2011 and 2015 respectively.
AI examiner evaluation
| Criterion | Band |
|---|---|
| Task Achievement / Task Response | 4.0 |
| Coherence and Cohesion | 5.0 |
| Lexical Resource | 5.0 |
| Grammatical Range and Accuracy | 5.0 |
| Overall | 5.0 |
Task Achievement / Task Response: Band 4.0
You identify the chart’s subject and make an attempt at an overview, noting that the $100,000-or-more group is large and that the $25,000–$49,999 group ranks second. However, the overview is unclear and partly inaccurate: the highest-income group was not the largest in 2007 or 2011; it became the largest in 2015. The claim that lower-income households had the lowest numbers is also incorrect, since the $75,000–$99,999 group was lowest in 2007 and 2011, while the $50,000–$74,999 group was lowest in 2015. Most categories and their changes are omitted, and some figures are confused. The response is also 18 words below the required minimum. Include a clear overview and compare the main trends across all income bands.
Coherence and Cohesion: Band 5.0
The response has a basic structure: an introduction, an overview, and a final paragraph with selected figures. This gives the reader some sense of how the information is organised. However, progression is limited because the final paragraph moves between income groups without clearly explaining the comparisons, and the overview contains several ideas joined together in a difficult-to-follow sequence. Linking words such as “While” and “Then” are used, but they do not consistently show the relationship between points. The final sentence is especially hard to follow because the years and figures are compressed together. Use separate, clearly focused paragraphs and organise the details by either income level or notable trend, with accurate links between comparisons.
Lexical Resource: Band 5.0
You use some relevant chart vocabulary, including “illustrates,” “income,” “households,” and “decline,” so the topic is generally recognisable. However, the range is limited and several word choices or collocations make the meaning unclear. For example, “five number of groups” is not a natural way to describe the categories, “elit one” is unsuitable for an income band, and “2nd sport” appears to mean “second place.” There are also spelling errors such as “thse,” “housechores,” and “decillne,” which distract the reader. Aim for precise, neutral language for describing data, and check spelling carefully. Terms such as “income category,” “highest-income households,” and “ranked second” would be more appropriate.
Grammatical Range and Accuracy: Band 5.0
You attempt both simple and more extended sentences, including an overview beginning “It can be easily seen” and a comparison introduced with “Then.” However, the range is limited, and errors in sentence construction and punctuation frequently make the message difficult to follow. For instance, “Overall, there are five number of groups … are shown” has an unclear grammatical structure, while “people with 25million to 49.999 million were taking the 2nd sport” does not form a clear comparison. Missing spaces after commas and full stops, as in “2007,2011” and “graph.It,” also affect readability. Practise building accurate sentences with a clear subject and verb, and use full stops to separate distinct comparisons.
See this exact question answered at other band scores. The same prompt compared across bands.
Browse more IELTS Writing model answers or get your own writing scored by the same AI examiner.