Band 4.0 IELTS Writing Task 1 Model Answer
Overall Band Score: 4.0 · Cambridge IELTS 18 · 2026-11-17
IELTS Writing Task 1 question
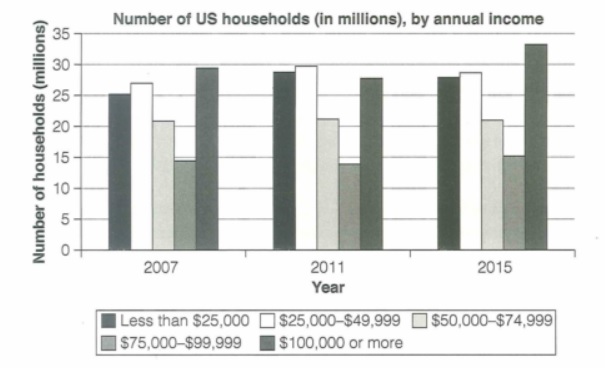
The chart below shows the number of households in the US by their annual income in 2007, 2011 and 2015.
Summarize the information by selecting and reporting the main features and make comparisons where relevant.
Student answer (Band 4.0)
The bar chart illustrates the number of the houdeholds in the the us by their annual income in 2007, 2011 and 2015 .
The bar have total 5 categories of household by annual income .
No.1 black colour show the less than $25000 income annual household is 25 percentage in US millons 2007 white colour 25 into 30 percentages annual income is $25000 to $[redacted phone] in US millons lite white colour is 20% and gery is 10 to 15% and last one lite balck is 25 to 30% in 2007.
Year 2011 black colour 25 into 30% white is 30% lite white 20 into25% ,grey 10 into 15% and last one lite black is 25 into 30% .
Year 2015 black and white into 25 to 30% lite white is 20 to 25% grey is 15% and last lite black is 30 to 35%.
AI examiner evaluation
| Criterion | Band |
|---|---|
| Task Achievement / Task Response | 3.5 |
| Coherence and Cohesion | 4.5 |
| Lexical Resource | 4.5 |
| Grammatical Range and Accuracy | 4.0 |
| Overall | 4.0 |
Task Achievement / Task Response: Band 3.5
The response identifies the chart’s subject and refers to all three years and five income groups, so it makes a basic attempt to report the data. However, it gives no clear overview of the main trends, and several figures are inaccurate or unclear: for example, the $50,000–$74,999 group is described as “20 into 25%” in 2011, although it remains about 21 million, while the figures are households in millions, not percentages. The highest-income group’s rise to about 33.5 million in 2015 is only given as a broad range. The response also contains 133 words, below the 150-word minimum; 11 words copied from the prompt were excluded from the count. Add a concise overview and report key comparisons accurately.
Coherence and Cohesion: Band 4.5
There is a basic chronological arrangement: the response describes 2007, then 2011, then 2015, and it signals the categories with phrases such as “Year 2011” and “Year 2015.” This gives the reader some way to follow the information. However, the response is presented as one block, without a separate overview or clear paragraphing, and the repeated list-like pattern makes progression mechanical. Phrases such as “black colour,” “white colour,” and “lite white” are difficult to connect reliably to the income categories. Organise the report into an introduction, an overview, and comparison paragraphs, and use clear references to income bands rather than colour descriptions.
Lexical Resource: Band 4.5
The response uses a small set of relevant terms, including “bar chart,” “households,” “annual income,” and the income ranges, showing some basic topic vocabulary. However, the range is limited and repetitive, with “colour” and “is” repeatedly used to describe the data. Several choices make the meaning unclear, such as “25 percentage in US millons” and “lite balck”; spelling errors such as “houdeholds,” “millons,” and “gery” also reduce clarity. Use standard chart language such as “number of households,” “million,” “income bracket,” “stood at,” and “rose to.” State values as millions of households, not percentages, and avoid relying on colour labels when the categories can be named directly.
Grammatical Range and Accuracy: Band 4.0
The response attempts simple statements and some sequencing, but sentence structures are very limited and many clauses lack a clear grammatical relationship. For example, “The bar have total 5 categories” has an agreement error, while the long descriptions beginning “No.1 black colour show…” are largely fragments rather than complete, controlled sentences. Articles and sentence boundaries are also inconsistent, as seen in the opening phrase “the the us” and the missing punctuation between several data points. These problems often make it difficult to understand which figure belongs to which year or category. Practise writing complete sentences with a clear subject and verb, and use consistent punctuation to separate comparisons.
See this exact question answered at other band scores. The same prompt compared across bands.
Browse more IELTS Writing model answers or get your own writing scored by the same AI examiner.