Band 5.5 IELTS Writing Task 1 Model Answer
Overall Band Score: 5.5 · Cambridge IELTS 18 · 2026-11-18
IELTS Writing Task 1 question
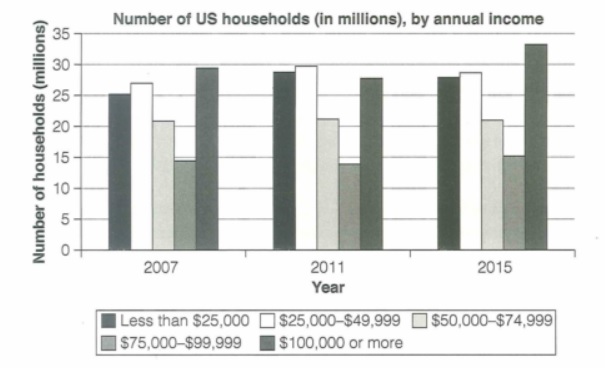
The chart below shows the number of households in the US by their annual income in 2007, 2011 and 2015.
Summarize the information by selecting and reporting the main features and make comparisons where relevant.
Student answer (Band 5.5)
The line graph compairs the numbers of household in US by theri annual income form 2007, 2011 and with 2015 and it is measured in millions.
It is clearly seen that, the numbers of household income is almost stable in 2007 and 2011 but in the year 2915 houses earning more than [redacted phone]$ has increased.
Looking into the picture, peole earning less than 25000$ in 2007 was in 25 millions by coming upto 2011 it grew up 4 millions and in 2015 it has decreased by 2 millions. Likewise earning between 25000$ to 49999$ is above 25 million in 2007 and below 30 millions in 2011 and around 35 in 2015.
Similarly, annula income from 50000$ to 74999$ is above 20 millions in 2007 aad same in 2011and 2015. Earning fro, 75000$ to 99999$ in below 15 millions and around 13 millions in 2011 nad 15 millions in 2015. earning [redacted phone]$ or more was below 30 millions in 2007 and around 28 in 2011 and it increased and rich around 33 millions in 2015.
AI examiner evaluation
| Criterion | Band |
|---|---|
| Task Achievement / Task Response | 5.5 |
| Coherence and Cohesion | 6.0 |
| Lexical Resource | 5.0 |
| Grammatical Range and Accuracy | 5.0 |
| Overall | 5.5 |
Task Achievement / Task Response: Band 5.5
You identify the chart’s subject and cover all five income groups, with relevant comparisons across the three years. The overview correctly notes that the $100,000-or-more group rises by 2015, and you report the broadly stable middle-income category. However, some figures and trends are inaccurate: the $25,000–$49,999 group is about 28.5 million in 2015, not around 35 million, and the under-$25,000 group falls only slightly from 2011 to 2015, rather than by two million. The overview also says the figures were almost stable in 2007 and 2011, which overlooks the rise in the two lower-income groups. Select the clearest overall patterns and check each comparison against the chart.
Coherence and Cohesion: Band 6.0
The response has a recognisable sequence: an introduction, an overview, and then details for the income bands. Linking expressions such as “Likewise” and “Similarly” help signal comparisons, and the reader can generally follow the categories being discussed. However, the progression is somewhat mechanical, with each group treated in turn rather than organised around the main trends. Some references are unclear, particularly “it grew up 4 millions,” where the subject and comparison are not expressed precisely. Paragraphing is also limited, and inconsistent capitalisation and punctuation interrupt the flow. Grouping the categories by trend—for example, rising, stable, and fluctuating—would make the comparisons easier to follow.
Lexical Resource: Band 5.0
You use relevant chart vocabulary, including “increased,” “decreased,” “stable,” and “measured in millions,” so the main subject is usually understandable. However, the range is limited and several word choices or collocations are inaccurate, such as “numbers of household income,” “houses earning,” and “grew up 4 millions.” Spelling errors—including “compairs,” “theri,” “annula,” and “rich” for “reached”—also make the writing less clear and less controlled. Use precise terms such as “number of households” and “households earning,” and choose verbs that describe chart movement accurately. Check spelling carefully, especially for key vocabulary that appears repeatedly in the report.
Grammatical Range and Accuracy: Band 5.0
You attempt both simple statements and longer comparative sentences, for example, “Looking into the picture, people earning less than 25000$ in 2007 was in 25 millions…” This shows an effort to describe changes over time, but the sentence patterns are often faulty and can make relationships difficult to understand. There are repeated problems with subject–verb agreement (“people … was”), plural forms (“numbers of household”), articles, and tense or clause construction. Some sentences also lack clear punctuation or a complete grammatical structure, as in “Similarly, annual income from 50000$ to 74999$ is above 20 millions in 2007 aad same in 2011and 2015.” Practise accurate comparative structures, such as “The number of households earning … rose from … to …,” before adding more complex clauses.
See this exact question answered at other band scores. The same prompt compared across bands.
Browse more IELTS Writing model answers or get your own writing scored by the same AI examiner.