Band 5.5 IELTS Writing Task 1 Model Answer
Overall Band Score: 5.5 · Cambridge IELTS 18 · 2026-11-18
IELTS Writing Task 1 question
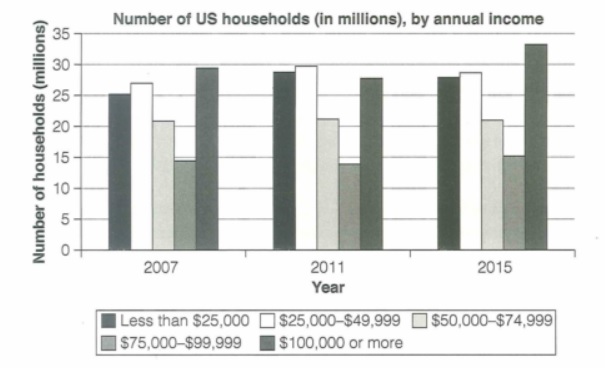
The chart below shows the number of households in the US by their annual income in 2007, 2011 and 2015.
Summarize the information by selecting and reporting the main features and make comparisons where relevant.
Student answer (Band 5.5)
INTRODUCTION :
The charts shows the number of households in the USA compared to their annual income in differnt time period (2007 , 2011 and 2015).
Analysis :
The charts tells us that in 2007 and 2015 the mist number of households was used by the highest income group (Above 100,000 $ ) while in 2011, the people earning 25,000 to 49,999 annually tops the charts by having the most number of households .
Paragraph 1 :
If we look closely to the chart, in 2007 , the people with annual income above 100,000 $ holds the most number of hoseholds about 30 millions followed by people earning annually 25,000 to 49,999. the people with income 75,000 to 99,999 holds the lowest number of households about 15 million.
Paragraph 2 :
Now in 2011, the people with annual income 25,000 to 49,999 tops the chart with having almost 30 million households followed by the people with income less than 25,000. The people earning 75,000 to 99,999 holds the lowest number of households both in year 2011 and 2015. In 2015, people with over 100,000 annaully income bypass the people earning about 25,000 to 49,999 by having over 30 millions households
AI examiner evaluation
| Criterion | Band |
|---|---|
| Task Achievement / Task Response | 5.5 |
| Coherence and Cohesion | 5.5 |
| Lexical Resource | 5.5 |
| Grammatical Range and Accuracy | 5.5 |
| Overall | 5.5 |
Task Achievement / Task Response: Band 5.5
You identify the main ranking changes: the $100,000-or-more group is largest in 2007 and 2015, while the $25,000–$49,999 group leads in 2011. You also report several relevant figures, such as about 30 million for the top group in 2007 and nearly 30 million for the leading group in 2011. However, the overview is brief and the account is selective: the stable $50,000–$74,999 category (about 21 million throughout) is not discussed, and the 2015 figures are only partly reported. The claim that the $75,000–$99,999 group is lowest in both 2011 and 2015 is inaccurate; in 2011, the $100,000-or-more group is lower. Include a clearer overview and compare the main movements across all three years.
Coherence and Cohesion: Band 5.5
The response has a recognisable structure, moving from an introduction and overview to paragraphs about 2007 and the later years. This helps the reader follow the broad time sequence, and phrases such as “In 2011” and “In 2015” signal changes in focus. However, the progression is not consistently clear: the second paragraph combines 2011 and 2015, and the overview repeats information that is then repeated in the detail paragraphs. Some linking is mechanical, as in “If we look closely to the chart” and “Now in 2011.” Use a concise overview followed by a consistent year-by-year or income-group comparison, and connect related comparisons directly rather than relying mainly on time markers.
Lexical Resource: Band 5.5
You use enough topic vocabulary to communicate the main categories and comparisons, including “annual income,” “highest income group,” “followed by,” and “lowest number.” However, word choice and collocation are often inaccurate or repetitive. For example, “the most number of households was used by” is unclear, and “tops the charts” is informal and repeated. “Bypass” does not naturally describe one category having more households than another; “exceeded” would be more precise. There are also noticeable spelling errors, including “differnt,” “hoseholds,” and “annaully,” which reduce the polish of the report. Aim for precise reporting verbs such as “stood at,” “recorded,” and “was the largest category,” and check spelling and standard forms of the income labels.
Grammatical Range and Accuracy: Band 5.5
You attempt both simple and more extended sentences, including comparisons with “while” and “followed by,” so the response is not limited to isolated statements. However, errors in sentence structure and agreement occur repeatedly and sometimes make relationships difficult to follow. For example, “The charts shows” has incorrect subject–verb agreement, while “the people … holds” and “the people … tops” also use mismatched verb forms. The sentence beginning “In 2015, people with over 100,000…” lacks a clear ending, leaving the comparison incomplete. Punctuation and spacing around commas are inconsistent, and several sentences run together without clear boundaries. Practise accurate agreement, complete sentence construction, and punctuation, while retaining a mix of simple and complex forms.
See this exact question answered at other band scores. The same prompt compared across bands.
Browse more IELTS Writing model answers or get your own writing scored by the same AI examiner.