Band 4.0 IELTS Writing Task 1 Model Answer
Overall Band Score: 4.0 · Cambridge IELTS 18 · 2026-11-18
IELTS Writing Task 1 question
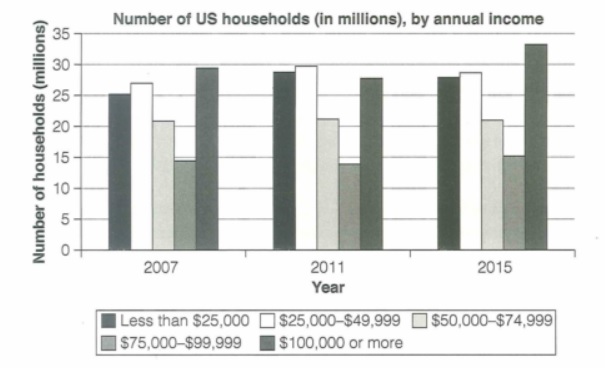
The chart below shows the number of households in the US by their annual income in 2007, 2011 and 2015.
Summarize the information by selecting and reporting the main features and make comparisons where relevant.
Student answer (Band 4.0)
The table displayed that the household in the US their annual income in 2007,2011 and 2015. The table provide information about householders from 2007 to 2015 from 0 to 35 million.
Overall, it can be observed that the incomes are different of each US citizen by their classes and occupation. In 2007 30 million US citizen who earns about 1000,000 dollars or more affords their house as, compared to
AI examiner evaluation
| Criterion | Band |
|---|---|
| Task Achievement / Task Response | 2.5 |
| Coherence and Cohesion | 3.5 |
| Lexical Resource | 4.5 |
| Grammatical Range and Accuracy | 4.5 |
| Overall | 4.0 |
Task Achievement / Task Response: Band 2.5
The response identifies the chart’s subject and years, but it does not provide a usable summary of the data. The overview claim that incomes differ “by their classes and occupation” is not supported by the chart, which compares household counts across income bands. The only figure given—“30 million” households earning “1000,000 dollars or more”—is inaccurate: the chart shows about 29.5 million in 2007 for the $100,000-or-more group, and the stated income threshold is also misread. The comparison is left unfinished at “compared to”. The response is also 88 words below the required minimum, with eight prompt words excluded from the count. To improve, report the main trends and several accurate comparisons, including the high-income group’s rise by 2015.
Coherence and Cohesion: Band 3.5
There is a basic attempt to organise the response: an opening sentence introduces the chart, followed by a sentence beginning “Overall”. However, the ideas do not develop into a complete summary, and the final comparison stops abruptly at “compared to”, leaving the reader without the point of the sentence. The overview also shifts to claims about citizens’ occupations, which do not connect logically to the chart’s household-income categories. The phrase “from 0 to 35 million” describes the scale rather than a trend, so it does not help progress the report. Use a clear sequence—introduction, overview, then grouped comparisons—and complete each sentence so the relationships between figures are explicit.
Lexical Resource: Band 4.5
The response uses a small set of relevant terms, including “household”, “annual income” and “million”, and the chart’s general subject is recognisable. However, several word choices are inaccurate or unnatural: “the household” suggests one household rather than a number of households, “US citizen” does not match the chart’s unit, and “affords their house” is not an appropriate way to describe income data. “Classes and occupation” also introduces concepts absent from the chart. These choices make the intended meaning difficult to follow, while the repeated use of “household” and “income” shows limited flexibility. Use precise chart vocabulary such as “number of households”, “income bracket” and “earned” or “reported an annual income of”.
Grammatical Range and Accuracy: Band 4.5
The response attempts connected sentences and an overview marker, but grammatical control is inconsistent. In “The table displayed that the household in the US their annual income”, the sentence lacks a clear grammatical structure and a verb linking households to income. “The table provide” has subject–verb disagreement, while “In 2007 30 million US citizen who earns…” has problems with number agreement and clause construction. The final sentence is incomplete after “compared to”. Punctuation is also weak, including the missing space in “2007,2011”. These errors make several statements hard to interpret. Build accurate simple sentences first, then add comparisons using controlled clauses, for example: “The number of households earning under $25,000 rose from 25 million in 2007 to about 28 million in 2015.”
See this exact question answered at other band scores. The same prompt compared across bands.
Browse more IELTS Writing model answers or get your own writing scored by the same AI examiner.