Band 5.5 IELTS Writing Task 1 Model Answer
Overall Band Score: 5.5 · Cambridge IELTS 18 · 2026-11-18
IELTS Writing Task 1 question
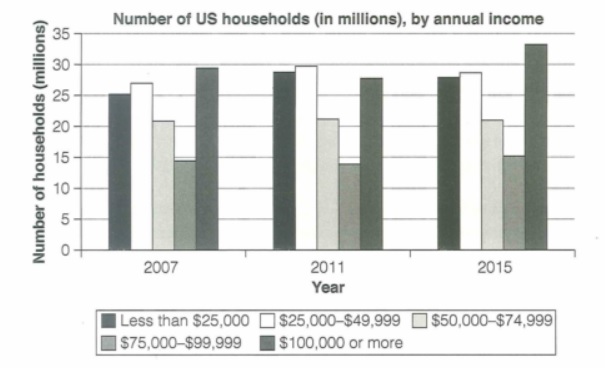
The chart below shows the number of households in the US by their annual income in 2007, 2011 and 2015.
Summarize the information by selecting and reporting the main features and make comparisons where relevant.
Student answer (Band 5.5)
The bar chart illustrates the percentage of family in the USA based on their yearly income in millions , in the year of 2007, 2011 and 2015.
Overall, $[redacted phone] or more income rate of family showed highest number of annual income first and last year, whilst $75000%-$99999 income rate family represented lowest number of annual income over the year. At the last every family annual income increased without $50000-$74999
In , 2007 less than $25000 income rate family accounted for 26% and $25000-$49999 at 27%. And $50000-$49999 consisted 22% and $75000-$99999 showed 14% of annual income. $[redacted phone] or more was the highest at 29%.
In 2011, first two income rate family increased steadily , where as last two one experienced decline. and middle one remain same. In 2015, $25000 and $25000-$49999 saw a slight downward. $50000-$74999 still same position. In contrast, $[redacted phone] showed significant growth in annual income rate and reached at 34% .
AI examiner evaluation
| Criterion | Band |
|---|---|
| Task Achievement / Task Response | 5.5 |
| Coherence and Cohesion | 5.5 |
| Lexical Resource | 5.0 |
| Grammatical Range and Accuracy | 5.0 |
| Overall | 5.5 |
Task Achievement / Task Response: Band 5.5
You identify several relevant features, including the high figure for households earning $100,000 or more and the stability of the $50,000–$74,999 group. However, the response only partly reports the chart accurately. It repeatedly describes household numbers as percentages or “income rates,” although the chart gives numbers of households in millions. Some figures are also assigned to the wrong category: in 2007, the $50,000–$74,999 group was about 21 million, not 22%, and the $75,000–$99,999 group was about 14.5 million. The overview’s claim that the $75,000–$99,999 group was lowest throughout is incorrect; the $50,000–$74,999 group was lower in 2015. Report the units clearly and compare the main trends more precisely.
Coherence and Cohesion: Band 5.5
The response has a basic paragraph structure, moving from an introduction and overview to details for 2007, 2011 and 2015. This gives the reader some organisation, and phrases such as “In contrast” signal a comparison. However, progression is not consistently clear: the 2011 and 2015 information is compressed into one paragraph, and several statements are difficult to follow, such as “At the last every family annual income increased without $50000-$74999.” The sequence of categories also shifts, while “first two,” “last two” and “middle one” do not clearly identify the groups. Use separate, logically ordered comparisons and repeat category labels where needed; this would make the relationships between years easier to understand.
Lexical Resource: Band 5.0
You use some task-related terms, including “accounted for,” “decline,” “slight downward” and “significant growth,” showing an attempt to describe trends. However, the vocabulary is limited and several repeated or inaccurate expressions make the data harder to interpret. “Percentage of family” and “income rate of family” are not suitable descriptions of this chart, which counts households, while “annual income” is sometimes used as if it were the measured quantity. There are also awkward phrases such as “highest number of annual income” and “reached at 34%.” Aim for precise chart language and natural collocations, for example “the number of households in this income band” and “rose to approximately 34 million.”
Grammatical Range and Accuracy: Band 5.0
The response attempts both simple and more complex sentences, but control is inconsistent, and errors frequently make relationships between ideas unclear. For example, “At the last every family annual income increased without $50000-$74999” lacks a clear grammatical structure, while “In 2011, first two income rate family increased steadily” has problems with articles, number agreement and sentence construction. Tense and verb forms are also unreliable in “middle one remain same” and “$25000 and $25000-$49999 saw a slight downward.” Punctuation and capitalisation are inconsistent, including the sentence beginning “and middle one.” Practise building complete sentences with a clear subject and verb, and use consistent past-tense forms to describe the three years.
See this exact question answered at other band scores. The same prompt compared across bands.
Browse more IELTS Writing model answers or get your own writing scored by the same AI examiner.