Band 4.5 IELTS Writing Task 1 Model Answer
Overall Band Score: 4.5 · Cambridge IELTS 18 · 2026-11-18
IELTS Writing Task 1 question
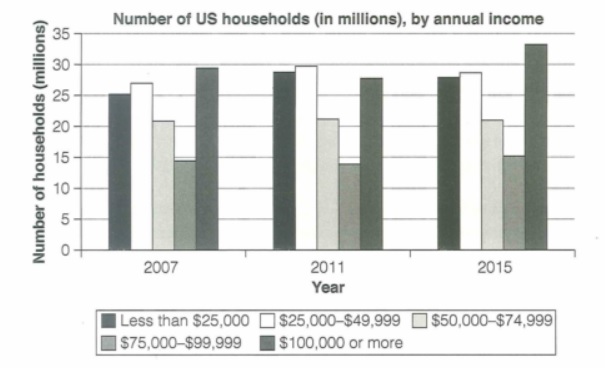
The chart below shows the number of households in the US by their annual income in 2007, 2011 and 2015.
Summarize the information by selecting and reporting the main features and make comparisons where relevant.
Student answer (Band 4.5)
The bar graph illustrates the US households yearly income in different years of 2007, 2011, 2015.
The bar chart shows the number in millions in five income groups comparing different years in 2007, 2011 and 2015. The income in 2007 is very low, but it increased after the year 2007 to 2015. While middle income groups stayed stable. Also it remained high till 2015.
The 25 million household's income remained less than $25,000 but rose after it and remained almost stable till 205.
In comparison, the 33 million households were more than $100,000 which was at lower income rate in both of the years, 2011 and 2007. The income between $75,000-$99,999 was increased with little rise. Overall, the bar chart shows the most of the population has more stable income rate till the year 2015.
AI examiner evaluation
| Criterion | Band |
|---|---|
| Task Achievement / Task Response | 4.0 |
| Coherence and Cohesion | 4.5 |
| Lexical Resource | 5.0 |
| Grammatical Range and Accuracy | 5.0 |
| Overall | 4.5 |
Task Achievement / Task Response: Band 4.0
The response identifies the chart’s subject and mentions several relevant income groups, but it reports the main features only minimally and some descriptions are unclear or inaccurate. For example, “the income in 2007 is very low” does not describe a specific group or overall pattern, and the claim that the under-$25,000 group “remained almost stable till 205” misstates the final year and misses its rise from about 25 million to around 28 million. You do note that the $50,000–$74,999 group stayed stable and that the highest-income group peaked in 2015, but the comparisons are not clearly developed. The response is also 15 words below the required minimum. To improve, give a precise overview and support it with accurate comparisons across all three years.
Coherence and Cohesion: Band 4.5
There is some basic organisation: the response begins by introducing the chart, then refers to income groups and ends with a general statement. However, the progression is difficult to follow because the opening and second sentences repeat the chart description, while later points are not arranged in a clear comparison. Phrases such as “In comparison” and “Overall” show an attempt to connect ideas, but the relationships they signal are not always clear; for instance, the sentence about 33 million households does not explain how this figure compares across years. The reference to “205” also interrupts the reader’s understanding. Group the information into a clear overview and focused comparisons, and use linking phrases only where the relationship between figures is explicit.
Lexical Resource: Band 5.0
The response uses a basic range of relevant terms, including “bar chart,” “income groups,” “remained stable,” and “increased,” so the topic is generally recognisable. However, vocabulary is repetitive and several word choices or collocations make the data difficult to interpret. “The US households yearly income” is not a natural way to describe the chart, and “the income in 2007 is very low” does not clearly identify what is low. The repeated use of “income” also obscures the distinction between household numbers and income categories. Use precise chart language such as “the number of households,” “income bracket,” “rose,” and “fell,” and name the relevant category whenever describing a trend.
Grammatical Range and Accuracy: Band 5.0
The response attempts a few longer structures, including “While middle income groups stayed stable” and “which was at lower income rate,” but control is inconsistent. The opening phrase “in different years of 2007, 2011, 2015” lacks a natural grammatical connection, and “The 25 million household's income” has problems with number and possessive structure. The sentence beginning “While” is a fragment, while “the 33 million households were more than $100,000” does not form a clear comparison. These errors sometimes make the intended meaning hard to recover. Practise complete sentences with a clear subject and verb, and use accurate patterns such as “There were about 25 million households earning under $25,000” and “the figure rose to…”.
See this exact question answered at other band scores. The same prompt compared across bands.
Browse more IELTS Writing model answers or get your own writing scored by the same AI examiner.