Band 5.0 IELTS Writing Task 1 Model Answer
Overall Band Score: 5.0 · Cambridge IELTS 18 · 2026-11-19
IELTS Writing Task 1 question
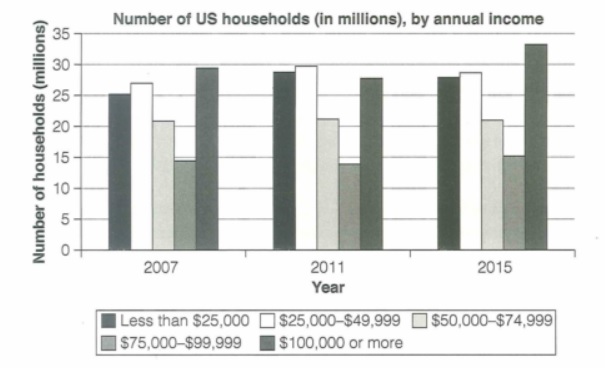
The chart below shows the number of households in the US by their annual income in 2007, 2011 and 2015.
Summarize the information by selecting and reporting the main features and make comparisons where relevant.
Student answer (Band 5.0)
The bar chart illustrates the household counts in the US by their yearly income ( in millions) in the year of 2007,2011 and 2015.
Overall, in 2007 around 30 million people have the highest income around $100,000, and the lowest number of houses approximately 20 million income are 75,000-99,999. It increases in the year of 2011 and some remains same. Some households who earn up to $100,000 increase rapidly in the year of 2015 which is around 34 million, and the lowest income in this year is 15 million.
There are some frequent chenges in these years some households whith highest incomes increases some with lowest incomes decreases. However, the improvement in visible. By 2015 the number of householed income rise from less then $25000 to $100,000 all are improves.
AI examiner evaluation
| Criterion | Band |
|---|---|
| Task Achievement / Task Response | 4.0 |
| Coherence and Cohesion | 5.0 |
| Lexical Resource | 5.0 |
| Grammatical Range and Accuracy | 5.0 |
| Overall | 5.0 |
Task Achievement / Task Response: Band 4.0
You identify the chart’s subject and mention some relevant features, including the peak of about 30 million households in the $100,000-or-more group in 2007 and its rise to roughly 34 million in 2015. However, the response addresses the task only partially: several comparisons are unclear or inaccurate. For example, the lowest group in 2015 was $75,000–$99,999 at about 15 million, not “the lowest income,” and the $50,000–$74,999 group stayed near 21 million throughout. The overview also says that households earning up to $100,000 increased, although the figures do not support this as a general trend. The response is 20 words below the required minimum, which limits the detail available. Select the main trends accurately and support them with clear comparisons.
Coherence and Cohesion: Band 5.0
The response has a basic paragraph structure: an introduction, an overview, and a final paragraph with further observations. This gives the reader some sense of organisation, and phrases such as “Overall” and “By 2015” signal a shift in focus. However, there is no clear progression through the income groups or years, and several links between ideas are difficult to follow. For instance, “It increases in the year of 2011 and some remains same” does not make clear which figures changed or stayed stable. The final paragraph repeats broad claims rather than developing a comparison. Organise the body around the main patterns—such as the stable middle-income group and the changing highest-income group—and use precise references to connect each point.
Lexical Resource: Band 5.0
You use some relevant chart vocabulary, including “bar chart,” “household counts,” “highest incomes,” and “approximately,” so the topic is generally recognisable. However, the range is limited and several word choices or forms make the meaning unclear. “The improvement in visible” is not an appropriate description of changes in household numbers, while “householed income rise” does not clearly identify what is increasing. There are also noticeable spelling errors, including “chenges,” “whith,” “householed,” and “less then.” Use accurate terms such as “number of households,” “income bracket,” “rose,” and “remained stable.” Check spelling carefully and avoid describing numerical increases as an “improvement” unless the chart supports that interpretation.
Grammatical Range and Accuracy: Band 5.0
You attempt both simple and longer sentence forms, including “Some households who earn up to $100,000 increase rapidly in the year of 2015,” but control is inconsistent and errors occur frequently. Tense and agreement problems appear in “people have the highest income” and “some remains same”; the chart describes past years, so past-tense forms are needed. Sentence construction is also faulty in “the lowest number of houses approximately 20 million income are 75,000-99,999,” making the comparison hard to understand. Articles, plurals, and punctuation are inconsistent, as in “in the year of 2007,2011 and 2015.” Practise clear past-tense reporting patterns, such as “The figure for this group rose to…” and “The number remained stable at…,” and separate complete ideas with accurate punctuation.
See this exact question answered at other band scores. The same prompt compared across bands.
Browse more IELTS Writing model answers or get your own writing scored by the same AI examiner.