Band 4.5 IELTS Writing Task 1 Model Answer
Overall Band Score: 4.5 · Cambridge IELTS 18 · 2026-11-19
IELTS Writing Task 1 question
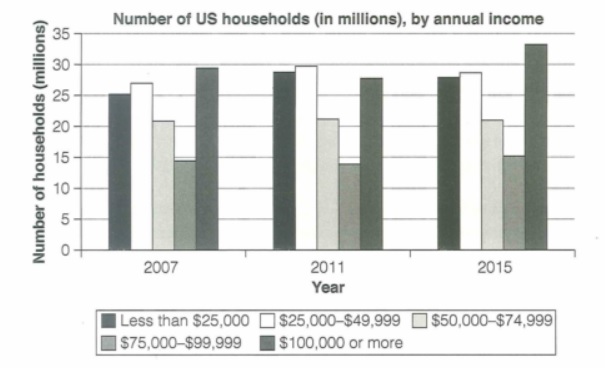
The chart below shows the number of households in the US by their annual income in 2007, 2011 and 2015.
Summarize the information by selecting and reporting the main features and make comparisons where relevant.
Student answer (Band 4.5)
the bar illustrates the number of households in the US by their annual income in 2015 is increase rather than 2007and 2011.
overall,the number of us households by annual income are 2015 in increase rather than year 2007 and 2011.while 2011year in $25,000- $49,999 are increase wherease,2007 and 2015 are slightly below this levels. other groups in income are same US householdsbut 2007 and 2011year are same income in the US.
In, 2007 less than income $25,000 and slightly increase in the other groups and increase in the $25,oo-$49,000 in the year of 2007.while the year 2011 approximately $25,000-$49,000 other groups in income are same and slightly different .wherease the year 2015 in US income are one groups are increase rather than other groups. in annual income of US payment are increase in the 2015 years but other groups are payment are same all groups sometimes are upwards and sometimes are downwords.number of US households in million income.
AI examiner evaluation
| Criterion | Band |
|---|---|
| Task Achievement / Task Response | 4.0 |
| Coherence and Cohesion | 4.0 |
| Lexical Resource | 4.5 |
| Grammatical Range and Accuracy | 4.5 |
| Overall | 4.5 |
Task Achievement / Task Response: Band 4.0
You attempt to describe the chart and identify that the figures for 2015 are generally higher, but the overview is unclear and several comparisons do not match the data. For example, the $25,000–$49,999 group was highest in 2011, not simply “slightly below” in 2007 and 2015; the $50,000–$74,999 category stayed at about 21 million in all three years, while the $100,000-or-more group rose markedly to about 33.5 million in 2015. These key features are not reported accurately or clearly, and some statements, such as “other groups … are same,” are too vague. The response is also four words below the 150-word minimum. To improve, give a precise overview and support it with accurate figures and comparisons.
Coherence and Cohesion: Band 4.0
There is an attempt to separate an overview from details, and time references such as “In, 2007” and “the year 2015” show an effort to organise information chronologically. However, the ideas are not arranged in a clear progression: the opening and overview repeat the same general claim, while the later sentences move between years and income groups without a consistent pattern. Linking words such as “while,” “wherease,” and “and” do not reliably show how the comparisons relate, and several references, including “other groups,” are unclear. A clearer structure would use one paragraph for the main overview and then group the figures by meaningful trends, such as the stable middle-income category and the rise in the highest-income group.
Lexical Resource: Band 4.5
Your vocabulary is basic and repetitive, with frequent reliance on “increase,” “same,” “groups,” and “income.” This makes it difficult to express the chart’s different patterns precisely. Some choices are also inaccurate or unnatural, such as “payment” for household income and “the bar illustrates” when describing a chart. Spelling and form errors, including “wherease” and “downwords,” further reduce clarity. There is an attempt to use comparison language, for example “slightly below” and “rather than,” but these phrases are sometimes used in ways that do not communicate the intended relationship. Build a small range of accurate chart vocabulary—such as “remained stable,” “rose,” “fell,” and “was the largest category”—and use it consistently.
Grammatical Range and Accuracy: Band 4.5
The response attempts longer sentences and uses time clauses, but grammatical errors are frequent and sometimes make the intended comparisons difficult to follow. Examples include “the number … are 2015 in increase,” “2011year in … are increase,” and “other groups … are same,” where sentence structure, verb forms, and agreement are not controlled. Articles and punctuation are also inconsistent, as in “the year 2015” and the comma after “overall,” while several sentences run together without clear boundaries. Most clauses follow a similar simple pattern, so the range is limited despite attempts to connect ideas with “while” and “whereas.” Practise accurate basic comparison sentences first, then combine them: “The figure rose from 29.5 million in 2007 to 33.5 million in 2015.”
See this exact question answered at other band scores. The same prompt compared across bands.
Browse more IELTS Writing model answers or get your own writing scored by the same AI examiner.