Band 6.0 IELTS Writing Task 1 Model Answer
Overall Band Score: 6.0 · Cambridge IELTS 18 · 2026-11-20
IELTS Writing Task 1 question
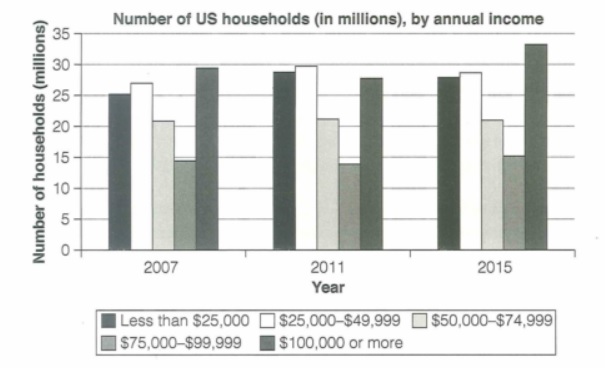
The chart below shows the number of households in the US by their annual income in 2007, 2011 and 2015.
Summarize the information by selecting and reporting the main features and make comparisons where relevant.
Student answer (Band 6.0)
The study show how the number of US households with their income changes on three interval years. The chart shows that people who falls in the light gray and gray scales shows no change in their number over the three years, which is understandble as those people fall in the category of middle class people.
In 2007, Number of households that falls in the black scale is 25 million and that indicates that there were many people that were poor. Low middle class households were higher than poor ones by 2 to 3 million, however, middle class and high-middle class households were relarively lower in number. Moreover, high class households scored the highest population in this year.
In 2011, low-class households number increased to 29 million and that indicates decreasing of economic level of the US than 2007. Low middle class households were higher than poor ones by just a million. Middle class and high-middle class households stayed the same as in 2007. Moreover, high class households number decreased to be lower than low class and low-middle ones.
In 2015, economy raised a lot, as the number of households in low and low middle class decreased a little bit, however, middle class and high-middle class households stayed the same. Moreover, high class households number increased than the previous years.
In conclusion, that study is an indication of the economic status of the US across these years and it is safe to say that 2015 was a great year on the US citizens. Also, middle class is the most safe class that does not fluctuate on the passing of years.
AI examiner evaluation
| Criterion | Band |
|---|---|
| Task Achievement / Task Response | 6.0 |
| Coherence and Cohesion | 6.0 |
| Lexical Resource | 5.5 |
| Grammatical Range and Accuracy | 5.5 |
| Overall | 6.0 |
Task Achievement / Task Response: Band 6.0
You identify the chart’s broad subject and compare all three years, including the rise in the $100,000-or-more group by 2015 and the relative stability of some middle-income groups. However, several descriptions are inaccurate or too general. The $50,000–$74,999 group stays at about 21 million, but the $75,000–$99,999 group changes slightly, so saying both “stayed the same” is not precise. In 2015, the two lowest-income groups fall only slightly, while the highest-income group reaches its peak. The claims that the figures show a changing “economic level” and that 2015 was “a great year” are interpretations the chart cannot establish. A clearer overview of the main trends, supported by accurate category labels and comparisons, would make the report more complete.
Coherence and Cohesion: Band 6.0
The response has a clear overall arrangement: an introduction, separate paragraphs for 2007, 2011 and 2015, and a concluding statement. This makes the year-by-year account easy to follow. However, the repeated pattern of “Moreover” and “In [year]” makes the progression somewhat mechanical, and the conclusion repeats interpretations rather than synthesising the chart’s main trends. Some references are also unclear: “people who falls in the light gray and gray scales” requires the reader to infer which income groups are meant, and “those people” is imprecise. Grouping the data by trend—for example, the highest-income category, the two lower-income categories, and the stable middle band—would create stronger comparisons across years and reduce repetition.
Lexical Resource: Band 5.5
You use relevant chart vocabulary such as “increased,” “decreased,” “higher,” and “population,” and you attempt more specific labels such as “low middle class” and “high class.” However, the income categories are not consistently named, and class labels such as “poor” or “high class” are not equivalent to the chart’s income bands. Several word choices and collocations are awkward, including “three interval years,” “scored the highest population,” and “economy raised a lot.” There are also spelling errors, for example “understandble” and “relarively.” Use the chart’s exact income ranges and practise natural reporting phrases such as “the number of households in this bracket rose” or “remained broadly stable” to improve precision and control.
Grammatical Range and Accuracy: Band 5.5
You use a mixture of simple statements and longer sentences, including clauses linked with “however,” “as,” and “which,” so there is some structural variety. The main message is generally understandable, but some grammatical errors recur. For example, “The study show” has subject–verb disagreement, and “people who falls” also needs agreement. In “the number of households … is,” the singular head noun “number” should guide the verb, while “households number decreased” needs a clearer grammatical structure. Articles and sentence punctuation are also inconsistent, as in “In 2007, Number of households.” Review agreement, noun phrases, and sentence boundaries, then check each longer sentence for a clear subject and verb. This would make your comparisons easier to read.
See this exact question answered at other band scores. The same prompt compared across bands.
Browse more IELTS Writing model answers or get your own writing scored by the same AI examiner.