Band 5.5 IELTS Writing Task 1 Model Answer
Overall Band Score: 5.5 · Cambridge IELTS 18 · 2026-11-21
IELTS Writing Task 1 question
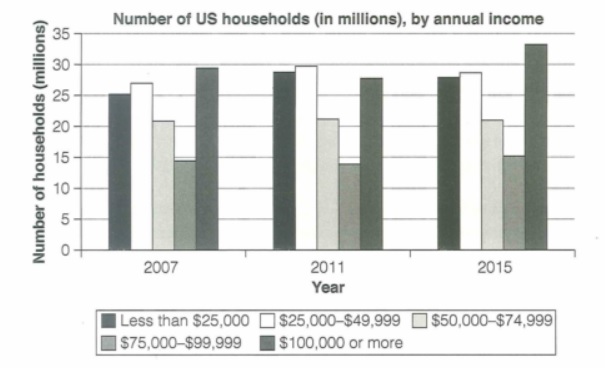
The chart below shows the number of households in the US by their annual income in 2007, 2011 and 2015.
Summarize the information by selecting and reporting the main features and make comparisons where relevant.
Student answer (Band 5.5)
The bar chat illustrates how many US household fell into five annual income bracket in 2007 , 2011 and 2015.
overall, the $25000 -$49000 and [redacted phone] or more groups were the largest throughout while the 75000 -$ 99999 groups was smallest. the top group income bracket was the only one to show a clear upward trend by 2015.
In 2007 about 29.5 million household earn [redacted phone] or more the higest figure followed by roughly 27 million in the 25000 - 49999 bracket.Around 25 million household earn under 25000 while the 50000 - 74999$ and 75000 - 99999$ groups stood at about 21 million and 14.5 million respectively.
by 2011, the lowest 2 bracket had grown to about 29 and 30 million where the top bracket fell slight too 28 million.
In 2015, the number of household earning [redacted phone]$ or more rose sharply to about 33 million the highest figure in the whole chart
AI examiner evaluation
| Criterion | Band |
|---|---|
| Task Achievement / Task Response | 5.5 |
| Coherence and Cohesion | 6.0 |
| Lexical Resource | 5.5 |
| Grammatical Range and Accuracy | 5.5 |
| Overall | 5.5 |
Task Achievement / Task Response: Band 5.5
You identify the main income groups and include several relevant figures, such as the 29.5 million households earning at least $100,000 in 2007 and the rise to about 33 million in 2015. The overview also correctly notes the strong final increase in the highest-income group. However, the overview is not fully accurate: the $25,000–$49,999 group was not among the largest throughout, since the $100,000-or-more group was largest in 2007 and 2015, while the $25,000–$49,999 group led in 2011. The claim that the $75,000–$99,999 group was smallest throughout is also incorrect; it was smallest in 2007 and 2011, but the $50,000–$74,999 group was smaller in 2015. Include the missing 2015 comparisons to make the summary more complete.
Coherence and Cohesion: Band 6.0
The response has a recognisable structure: an introduction, an overview, and paragraphs describing the figures by year. Time markers such as “In 2007,” “by 2011,” and “In 2015” help the reader follow the sequence. However, the progression is somewhat mechanical and the final paragraph is very brief, leaving the 2015 data for most income groups unreported. Some comparisons could be linked more clearly across years rather than presented as separate snapshots. For example, explain that the two lower-income groups rose by 2011 and then eased slightly by 2015. Use consistent paragraph openings and punctuation, and connect related figures with phrases such as “by contrast” or “whereas” to make the comparisons flow more naturally.
Lexical Resource: Band 5.5
You use relevant task vocabulary, including “income bracket,” “followed by,” “stood at,” and “rose sharply,” which helps communicate the chart’s subject and changes. However, the range is limited, and several word-choice, spelling, and form errors reduce precision: “bar chat” for “bar chart,” “higest,” and “household” where the plural is needed. Some expressions are awkward, such as “the lowest 2 bracket had grown” and “the top bracket fell slight.” Use accurate terms consistently, for example “income category” or “income band,” and choose verbs that describe the data precisely, such as “increased,” “declined slightly,” and “remained stable.” Correct spelling and standard formatting of income ranges will also make the report more professional.
Grammatical Range and Accuracy: Band 5.5
You attempt both simple and more developed sentence forms, and the main meaning is generally understandable. However, errors in agreement, articles, verb forms, and sentence boundaries occur in several places. For example, “how many US household fell” needs plural agreement and a suitable verb form, while “29.5 million household earn” needs a plural noun and a consistent past tense. The sentence beginning “In 2015” lacks a final full stop, and the overview’s clauses need clearer punctuation and agreement. Build accuracy by checking each sentence for a clear subject and verb, using past tense consistently for the historical years, and adding articles where needed. A wider range of accurately controlled comparisons would strengthen the report.
See this exact question answered at other band scores. The same prompt compared across bands.
Browse more IELTS Writing model answers or get your own writing scored by the same AI examiner.