Band 4.5 IELTS Writing Task 1 Model Answer
Overall Band Score: 4.5 · Cambridge IELTS 18 · 2026-11-21
IELTS Writing Task 1 question
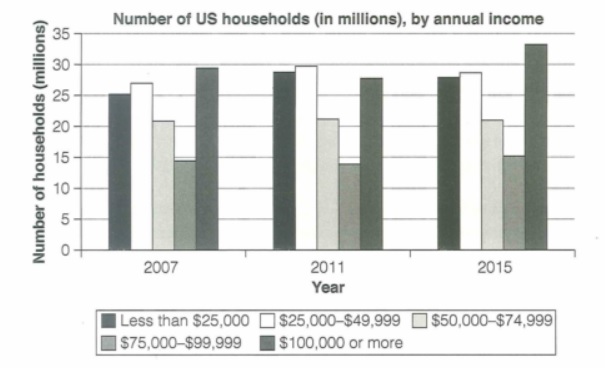
The chart below shows the number of households in the US by their annual income in 2007, 2011 and 2015.
Summarize the information by selecting and reporting the main features and make comparisons where relevant.
Student answer (Band 4.5)
The bar graph illustrates the number of households earning annual income in the US the year in 2007,2011, and 2015.
Overall, it is the highest income in 2015; moreover, it shows the highest income in 2011 and last data show the lowest household income in 2007.
In 2015, the income was around 1,00,000$ over the year for 33 million people and in 2011 years the income decreased to around 27 million to 29 million by 2001.
AI examiner evaluation
| Criterion | Band |
|---|---|
| Task Achievement / Task Response | 3.0 |
| Coherence and Cohesion | 4.5 |
| Lexical Resource | 5.0 |
| Grammatical Range and Accuracy | 5.0 |
| Overall | 4.5 |
Task Achievement / Task Response: Band 3.0
The response identifies the chart’s subject and mentions the three years, and it notices that the $100,000-or-more group was highest in 2015. However, the overview is unclear and partly inaccurate: “it shows the highest income in 2011” does not identify which income group, and the lowest figure was the $75,000–$99,999 group in 2011, not household income in 2007. The body gives only one approximate figure and does not compare the five income bands or describe their changes. The reference to “2001” is also inconsistent with the chart. At this level, the task is addressed only partially and the key features are underdeveloped. Include a clear overview and several accurate comparisons. The response is also below the required 150 words.
Coherence and Cohesion: Band 4.5
There is a basic attempt to organise the response, with an opening sentence, an overview paragraph, and a final paragraph about figures. This gives the reader some sense of the intended structure. However, the progression is difficult to follow because the overview repeats “highest income” without specifying a category, while the final paragraph shifts between income and household numbers without a clear comparison. The connector “moreover” does not show a logical relationship between the claims that follow it. The response also ends without a concluding comparison or fuller account of the data. To improve, organise the body by meaningful groups or trends and use linking phrases only when they accurately express the relationship between ideas.
Lexical Resource: Band 5.0
The response uses some relevant chart vocabulary, including “bar graph,” “households,” “annual income,” and “decreased,” so the topic is generally recognisable. However, the range is limited, and several phrases are imprecise or awkward: “the highest income” refers to a category rather than an income amount, and “33 million people” mislabels households as people. The expression “around 1,00,000$ over the year” is also unclear and does not accurately describe the income band. Use precise terms such as “households earning” and “income bracket,” and report values as numbers of households in millions. A wider set of comparison verbs, such as “rose,” “remained stable,” and “peaked,” would help describe the chart more effectively.
Grammatical Range and Accuracy: Band 5.0
The response attempts a few different sentence forms, including an overview joined with “moreover” and a sentence beginning “In 2015.” Some basic meaning can be recovered, but grammatical control is uneven. The opening phrase “the year in 2007,2011, and 2015” has an incorrect construction and missing spacing after commas. In “in 2011 years the income decreased,” the time expression is not formed correctly, and the sentence’s comparison structure is incomplete. The final clause, “by 2001,” also creates confusion about the time reference. Most sentences are short or structurally simple, and the attempted longer sentence is not controlled. Practise accurate time phrases and complete comparison sentences, for example, “The figure rose from … in 2007 to … in 2011.”
See this exact question answered at other band scores. The same prompt compared across bands.
Browse more IELTS Writing model answers or get your own writing scored by the same AI examiner.