Band 5.5 IELTS Writing Task 1 Model Answer
Overall Band Score: 5.5 · Cambridge IELTS 18 · 2026-11-21
IELTS Writing Task 1 question
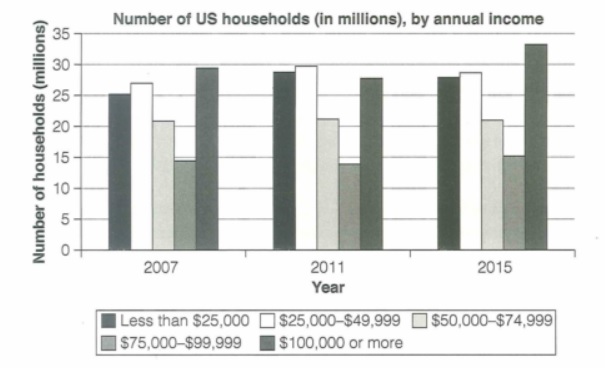
The chart below shows the number of households in the US by their annual income in 2007, 2011 and 2015.
Summarize the information by selecting and reporting the main features and make comparisons where relevant.
Student answer (Band 5.5)
The bar chart illustrates the counts of the households of US by their yearly salary in time period of 2007, 2011, and 2015.
Overall, it is clearly noticeable that the high proportion of income showed in 2015 and least in 2007.
To commence with the first time period is 2007, 25 million people have less income from 25,000 dollars. 30 million people have more than $100,000 salary per annum which is high amount income as compare to other.
Moving further with 2011, most of the people have salary within $25,000-$49,000 with almost 30 million people. 13 million have salary of $75,000-$99,999 in this time period which is least counts among this year.
At last, in 2015, 33 million people have salary more than $100,000 or more. Following the next critrea in which second highest number of people with 28 million counts in income within $25,000-$49,999. The people who have income in between $75,000-$99,999 with 15 million people survive with this salary.
AI examiner evaluation
| Criterion | Band |
|---|---|
| Task Achievement / Task Response | 5.0 |
| Coherence and Cohesion | 6.5 |
| Lexical Resource | 5.5 |
| Grammatical Range and Accuracy | 5.0 |
| Overall | 5.5 |
Task Achievement / Task Response: Band 5.0
You identify the three years and report several relevant figures, including the peak of about 33 million households earning $100,000 or more in 2015 and the relatively low figure for the $75,000–$99,999 group. However, the overview is unclear and inaccurate: “the high proportion of income showed in 2015 and least in 2007” does not specify which income group or describe the overall pattern. Some figures are also imprecise or misreported: the 2007 top-income group is about 29.5 million, not 30 million (a reasonable approximation), but the 2011 $75,000–$99,999 group is about 14 million rather than 13. The response also omits notable comparisons, such as the stable $50,000–$74,999 group and the rise in the top-income group by 2015. A clearer overview and more accurate, selective comparisons would strengthen coverage.
Coherence and Cohesion: Band 6.5
The response has a clear basic structure: an introduction, an overview, and separate paragraphs for 2007, 2011 and 2015. Time markers such as “To commence,” “Moving further” and “At last” help readers follow the sequence, and the information is generally grouped by year. This meets the lower-band expectation of an overall coherent arrangement. However, the progression is somewhat mechanical, and some links between ideas are unclear. For example, “Following the next critrea” does not clearly explain how the $25,000–$49,999 figure relates to the preceding point. The overview also does not prepare the reader for the year-by-year details. Grouping categories by trend—for instance, comparing the highest-income group across all years—would create a more purposeful progression and smoother cohesion.
Lexical Resource: Band 5.5
You use relevant task vocabulary, including “bar chart,” “per annum,” “income” and “salary,” and the income bands are mostly identified clearly. There is some attempt to vary wording, but the range is limited and several choices are inaccurate or unnatural, which can make the meaning less precise. For example, “counts of the households” is awkward, “high proportion of income” does not describe the number of households, and “least counts” is not a natural way to refer to the smallest figure. “People” is also repeatedly used where the chart measures households, not individuals. Spelling errors such as “critrea” further reduce accuracy. Aim for precise chart language and natural collocations, such as “the number of households,” “the highest figure,” and “the lowest category.”
Grammatical Range and Accuracy: Band 5.0
The response uses mostly simple sentence patterns, with a few attempts to add detail through clauses and phrases. However, grammatical errors are frequent, and some sentences are difficult to interpret. Examples include “25 million people have less income from 25,000 dollars,” where the comparison structure is faulty, and “The people who have income … with 15 million people survive with this salary,” which lacks a clear grammatical relationship between the subject and the figure. Articles, prepositions and sentence construction are also inconsistent, as in “in time period of 2007” and “as compare to other.” To improve, practise accurate comparative structures and use complete sentences with a clear subject and verb, such as “The number of households earning under $25,000 was 25 million in 2007.”
See this exact question answered at other band scores. The same prompt compared across bands.
Browse more IELTS Writing model answers or get your own writing scored by the same AI examiner.