Band 4.0 IELTS Writing Task 1 Model Answer
Overall Band Score: 4.0 · Cambridge IELTS 18 · 2026-11-21
IELTS Writing Task 1 question
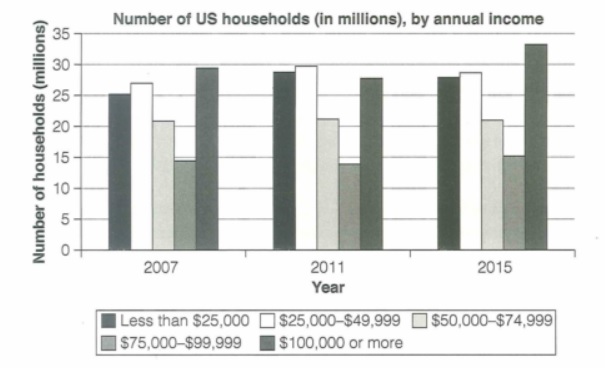
The chart below shows the number of households in the US by their annual income in 2007, 2011 and 2015.
Summarize the information by selecting and reporting the main features and make comparisons where relevant.
Student answer (Band 4.0)
The graph demonstrate the number of residents in the united states by their yearly income in 2 to 3 specified years.
Here the visual shows 3 years of data 2007, 2011 and 2015, and every year is further categories in 5 bars showing different information.
AI examiner evaluation
| Criterion | Band |
|---|---|
| Task Achievement / Task Response | 2.5 |
| Coherence and Cohesion | 4.0 |
| Lexical Resource | 4.5 |
| Grammatical Range and Accuracy | 4.5 |
| Overall | 4.0 |
Task Achievement / Task Response: Band 2.5
The response identifies the chart’s general subject and names the three years, so it shows a basic connection to the task. However, it does not summarise the data: there is no overview of the main trends, no comparison among income groups, and no figures are reported. The statement that the chart shows “residents” is also inaccurate, as it counts households. The task requires at least 150 words, and this response is substantially below that minimum, leaving the task largely unaddressed. To improve, give an overview—for example, that households earning $100,000 or more rose to the highest level in 2015—and support it with selected comparisons across the years.
Coherence and Cohesion: Band 4.0
The two sentences follow a simple, understandable order: the first introduces the chart’s subject, and the second identifies the years and categories. This gives the response a basic sense of organisation. However, there is no developed progression from an introduction to an overview and then to supporting details, and the second sentence mainly repeats information rather than advancing the summary. The phrase “Here the visual shows” is a weak transition and does not connect analytical points. Organise a complete response into clear paragraphs, using the overview to guide the comparisons and linking related figures with references such as “by contrast” or “while.”
Lexical Resource: Band 4.5
The response uses a small set of relevant terms, including “graph,” “number,” “income,” “years,” and “categories,” which makes its general topic recognisable. However, the vocabulary is limited and some choices are imprecise for this chart: “residents” refers to people rather than households, and “bars showing different information” is vague. “Yearly income” is understandable, but “annual income” would be more suitable for a formal chart summary. Expand the range of data-reporting language by using terms such as “households,” “income bracket,” “rose,” “remained stable,” and “accounted for,” and use them to describe actual comparisons rather than merely naming chart elements.
Grammatical Range and Accuracy: Band 4.5
The response communicates its basic meaning through two simple sentences, but grammatical control is uneven. In “The graph demonstrate,” the singular subject requires “demonstrates.” The phrase “the united states” needs capitalisation, and “every year is further categories” has an incorrect structure; a clearer form would be “each year is divided into five categories.” The sentence patterns are also very limited, with no accurate complex structures to express comparisons or trends. Practise subject–verb agreement, articles and plural forms, then combine accurate clauses using structures such as “while” and “whereas” to report differences between income groups.
See this exact question answered at other band scores. The same prompt compared across bands.
Browse more IELTS Writing model answers or get your own writing scored by the same AI examiner.