Band 6.0 IELTS Writing Task 1 Model Answer
Overall Band Score: 6.0 · Cambridge IELTS 18 · 2026-11-21
IELTS Writing Task 1 question
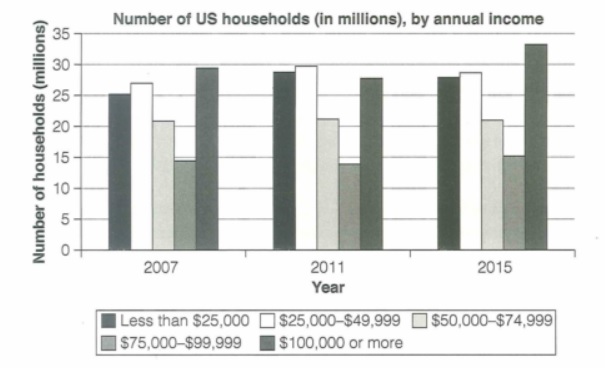
The chart below shows the number of households in the US by their annual income in 2007, 2011 and 2015.
Summarize the information by selecting and reporting the main features and make comparisons where relevant.
Student answer (Band 6.0)
The bar chart gives information on the numbers of households in the US by their yearly income from 2007 to 2015.
Overall, households with 100k and more annual wages were the highest number. On the other hand, the group earning from 75k to 99k had the lowest number.
At the beginning of 2007, families earning more than 100k had the highest number at just under 30 million. 25 and around 27 millions households were earning 25k or less and from 25k to 49k respectively. Families earning 75k to 99k were the lowest in number at just under 15 million while 21 million family units were earning between 50k to almost 75k. In 2011, most of the household's earning went up a little bit but a decline shown in the six figure earning families.
At 2015, two groups who were earning less than 25k and between 25k to almost 50k experienced growth and were just under 30 millions. Families earning 50k to 74k and 75k to almost 100k didn't show any impressive growth. However, households earning six figures and over peaked at just under 35%.
AI examiner evaluation
| Criterion | Band |
|---|---|
| Task Achievement / Task Response | 6.0 |
| Coherence and Cohesion | 6.0 |
| Lexical Resource | 6.0 |
| Grammatical Range and Accuracy | 6.0 |
| Overall | 6.0 |
Task Achievement / Task Response: Band 6.0
You identify the chart’s subject and give a clear overview of the highest and lowest income groups, then report figures for all five categories across the years. Most details are broadly accurate: for example, the $100,000-plus group was just under 30 million in 2007 and rose to about 33.5 million in 2015, while the $75,000–$99,999 group remained the smallest. However, the overview that the highest-income group was the largest throughout is not accurate: the $25,000–$49,999 group was slightly larger in 2011. Some trends are also described vaguely; the $50,000–$74,999 group was stable, while the $75,000–$99,999 group dipped slightly and then rose. Make the overview more precise and distinguish these changes.
Coherence and Cohesion: Band 6.0
The response has a recognisable structure: an introduction, an overview, and two paragraphs covering the years. This makes the information generally easy to follow, and transitions such as “On the other hand,” “In 2011,” and “However” help signal contrasts and time changes. At times, though, the progression is less clear because several figures are packed into long sentences, and phrases such as “most of the household’s earning went up” do not clearly identify which categories changed. The final paragraph also groups stable and rising categories without giving their exact movements. Organise the details more systematically—for example, compare the lower-income groups together, then the remaining categories—and use clear references to each income band.
Lexical Resource: Band 6.0
You use a sufficient range of chart-related vocabulary, including “annual wages,” “decline,” “experienced growth,” and “peaked,” and the income bands are generally identifiable. Some choices are imprecise or informal for an academic report: “100k and more annual wages” and “six figure earning families” are less natural than standard income-category wording, while “didn’t show any impressive growth” is subjective rather than factual. There are also word-form and collocation issues, such as “the highest number” when referring to households and “25 and around 27 millions households.” Choose precise terms such as “households earning $100,000 or more” and “remained stable,” and use “million” consistently after numbers.
Grammatical Range and Accuracy: Band 6.0
You use both simple and more complex sentence forms, including a contrast clause beginning “while” and the sentence “However, households earning six figures and over peaked…”. The main meaning is usually clear, but some grammatical errors remain. For example, “25 and around 27 millions households were earning” has incorrect number agreement and plural marking, and “most of the household’s earning went up” has an unclear possessive and subject–verb relationship. “At 2015” is also an incorrect time preposition, and “the group earning from 75k to 99k had the lowest number” would be clearer with a plural subject such as “households.” Review agreement, possessives, plurals, and time expressions, while retaining your varied sentence structures.
See this exact question answered at other band scores. The same prompt compared across bands.
Browse more IELTS Writing model answers or get your own writing scored by the same AI examiner.