Band 6.0 IELTS Writing Task 1 Model Answer
Overall Band Score: 6.0 · Cambridge IELTS 18 · 2026-11-22
IELTS Writing Task 1 question
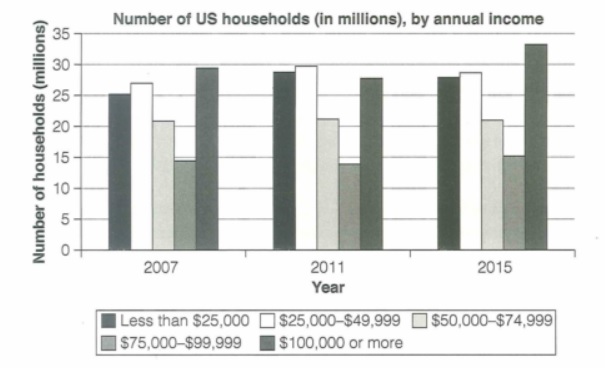
The chart below shows the number of households in the US by their annual income in 2007, 2011 and 2015.
Summarize the information by selecting and reporting the main features and make comparisons where relevant.
Student answer (Band 6.0)
The bar graph categorise the number of households in five categories accourding to their annual income in 2007, 2011 and 2015 in the United State.
Overall, three ranges of annual incoming people showed the similar trends over the period. they are the households whose annual income were $25,000 to $49,999, $50,000 to $74,499 and $75,000 to $99,999, respectively. The number of people of two ranges of annual income group such as less than $25,000 and $100,000 or more represented fluctuations over time.
The number of households whose income was less than $25,000 ranked third with 25 million households in 2007, while in 2011, this type of households number increased and ranked second with just below 30 million households. In 2015, the this number decreased to about 27 million households. In annual income range $25,000-$49,999, $50,000- $74,999 and $75,000-$99,999, in 2007 they represented about 26, just over 20 and around 15 million households, respectively, in 2011they rocorded 30, around 21 and around 14 million, respectively and in 2015, they recorded around 29, about 21 and 15 million, respectively.
The number of households whose total income in a year is $100,000 or more ranked first position with around 30 million households in 2007 and with around 34 million households in 2015. However, in 2011 this category of households ranked third,while $25,000-$49,999 annual income group took the first place.
AI examiner evaluation
| Criterion | Band |
|---|---|
| Task Achievement / Task Response | 6.5 |
| Coherence and Cohesion | 6.0 |
| Lexical Resource | 5.5 |
| Grammatical Range and Accuracy | 5.5 |
| Overall | 6.0 |
Task Achievement / Task Response: Band 6.5
You cover all five income groups and provide an overview, identifying broadly stable figures in the middle bands and changes in the lower- and highest-income groups. Several key comparisons are accurate: the $50,000–$74,999 group stays near 21 million, and the $100,000-or-more group rises to about 34 million by 2015. This meets the task well, with some features already selected and compared effectively. However, the overview is not fully accurate: the $25,000–$49,999 group does not show a similar trend to the stable middle group, and the highest-income group falls in 2011 before rising. Also, the under-$25,000 figure in 2015 is about 28 million, not 27 million. More precise trend summaries and clearer emphasis on the largest changes would strengthen the response further.
Coherence and Cohesion: Band 6.0
The response has a clear overall structure: an introduction, an overview, and two detail paragraphs. The figures are generally grouped by income bands, and sequencing the years within the middle-income categories helps the reader follow the comparisons. However, some connections are mechanical or unclear. The overview’s “they are” does not clearly link to the categories, while “The number of people of two ranges” is an awkward reference to household groups. The long sentence beginning “In annual income range…” packs several categories and all three years together, making comparisons harder to process. Improve progression by giving each paragraph a clear focus and using shorter, parallel comparisons; ensure pronouns and linking phrases refer unambiguously to the relevant income groups.
Lexical Resource: Band 5.5
You use relevant chart vocabulary, including “ranked third,” “increased,” “decreased,” and “fluctuations,” and you vary some references to the data rather than repeating one verb throughout. However, word choice and collocation are often inaccurate or unnatural, as in “annual incoming people,” “represented fluctuations,” and “took the first place.” There are also spelling and word-form errors such as “accourding” and “rocorded,” which reduce precision. Use standard terms such as “income bracket,” “households,” “rose,” and “fell,” and avoid describing household totals as people. Greater accuracy with these common expressions, alongside the relevant range already attempted, would make the report more fluent and precise.
Grammatical Range and Accuracy: Band 5.5
You attempt both simple and more complex sentences, including clauses introduced by “while” and “However,” and the overall meaning is usually recoverable. Some grammatical errors remain, particularly with agreement, articles, and sentence construction. For example, “The bar graph categorise” needs a singular verb, and “the this number” contains an unnecessary article. In “the households whose annual income were,” the verb does not agree with the singular noun “income.” The sentence listing three categories across three years is also difficult to control and would be clearer as separate sentences. Check subject–verb agreement and article use, and build complex comparisons from shorter, grammatically complete clauses. These changes would improve accuracy without sacrificing sentence variety.
See this exact question answered at other band scores. The same prompt compared across bands.
Browse more IELTS Writing model answers or get your own writing scored by the same AI examiner.