Band 5.5 IELTS Writing Task 1 Model Answer
Overall Band Score: 5.5 · Cambridge IELTS 14 · 2026-11-05
IELTS Writing Task 1 question
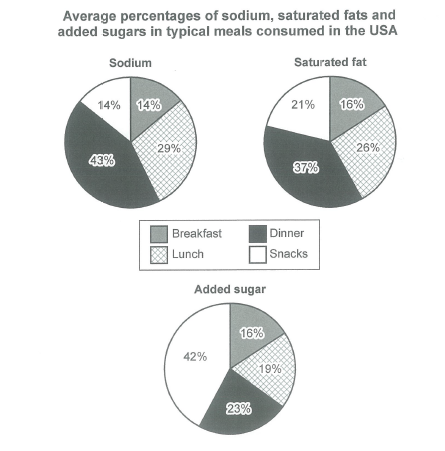
The charts below show the average percentages in typical meals of three types of nutrients, all of which may be unhealthy if eaten too much.
Summarize the information by selecting and reporting the main features, and make comparisons where relevant.
Student answer (Band 5.5)
here we have three different charts representing the average percentages of sodium, saturated fats and sugars in typical meals consumed in the USA. In the very first chart we can see that sodium is most abundant in dinner at 43% which is followed by lunch 29% and then snacks and breakfast both at 14% in this we can see that sodium is most consumed in dinner. The next chart illustrates the percentage of saturated fats present in the meals and the most amount is in dinner at 37%, then lunch at 26%, snacks at 21% and at the last breakfast which is 16% this tells us how much unhealthy fats are consumed in dinner. And if we talk about added sugar in the meals snacks are leading here by 42%, then dinner which stands at 23%, lunch at 19% and breakfast 16% snacks are the leading cause of excessive sugar consumption according to this data. this data represents the unhealthy trends of food consumption in the united states of america
AI examiner evaluation
| Criterion | Band |
|---|---|
| Task Achievement / Task Response | 6.0 |
| Coherence and Cohesion | 5.0 |
| Lexical Resource | 6.0 |
| Grammatical Range and Accuracy | 5.5 |
| Overall | 5.5 |
Task Achievement / Task Response: Band 6.0
You report the main figures accurately: dinner has the highest shares of sodium and saturated fat, while snacks lead for added sugar. You also include useful comparisons across all four meal types, so the key patterns are clear. However, the response lacks a distinct overview that synthesises these patterns; the repeated statements that dinner or snacks are “most consumed” largely restate individual figures. Some interpretation is also imprecise: the charts show the percentage of each nutrient by meal, not how much unhealthy food is consumed or which meal causes excessive consumption. To strengthen the report, add a concise overview of the contrasting peaks and avoid claims about consumption beyond what the percentages establish.
Coherence and Cohesion: Band 5.0
The information is presented in a sensible order, moving from sodium to saturated fat and then added sugar, and comparisons within each chart are generally easy to follow. However, the response is one continuous paragraph, so the overview and detailed reporting are not clearly separated. Linking is also repetitive: “the next chart,” “and if we talk about,” and repeated uses of “then” create a list-like progression rather than a well-shaped report. Some sentence boundaries are unclear, particularly where the added-sugar figures run directly into the concluding claim. Use an overview paragraph followed by organised detail, and connect comparisons more selectively to make the progression clearer.
Lexical Resource: Band 6.0
You use enough topic vocabulary to describe the charts, including “average percentages,” “saturated fats,” “leading,” and “consumption.” The meaning is generally clear, and the response attempts some variation rather than relying only on basic terms. However, several choices are imprecise or informal for an academic report. “Most abundant” does not naturally describe a percentage, while “most consumed” and “leading cause” make claims the chart does not establish. “At the last breakfast” is also an awkward way to introduce the smallest figure. Choose precise reporting language such as “accounted for,” “recorded,” and “the lowest proportion,” and use “added sugar” consistently with the chart label.
Grammatical Range and Accuracy: Band 5.5
The response includes both straightforward statements and longer clauses, and the figures remain understandable. Some sentence structures are controlled, such as “sodium is most abundant in dinner at 43%, which is followed by lunch.” However, several long sentences are joined without appropriate punctuation, especially the added-sugar comparison and the final claim. Capitalisation is inconsistent at the start of the response and after sentence boundaries, and the opening “here we have” is conversational rather than a well-formed report introduction. Break the information into complete sentences, use commas and full stops to mark comparisons clearly, and check sentence openings and punctuation. These changes would improve accuracy while retaining the range of structures attempted.
See this exact question answered at other band scores. The same prompt compared across bands.
Browse more IELTS Writing model answers or get your own writing scored by the same AI examiner.