Band 6.0 IELTS Writing Task 1 Model Answer
Overall Band Score: 6.0 · Cambridge IELTS 14 · 2026-11-10
IELTS Writing Task 1 question
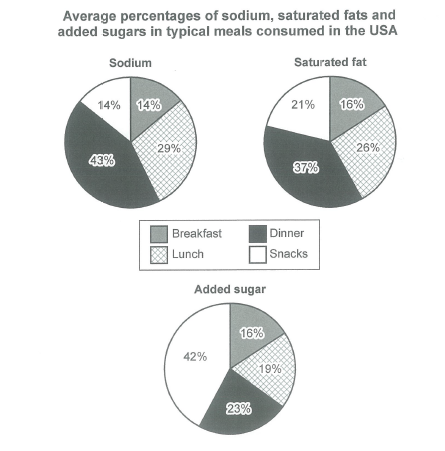
The charts below show the average percentages in typical meals of three types of nutrients, all of which may be unhealthy if eaten too much.
Summarize the information by selecting and reporting the main features, and make comparisons where relevant.
Student answer (Band 6.0)
The pie chart illustrate the average percentage of sodium,saturates fats and added sugars in typical meals consuming in breakfast,lunch dinner and snacks in USA.
Overall, sodium and saturated fat remained the largest consumer of food in dinner time, while the added sugar is highly consuming in snacks. On the other side , sodium, saturated fat and added sugar less consumed in breakfast.
Sodium made up the largest consumer in dinner at 43%, In addition , the proportion of sodium which is consumed in lunch approximately 29%.On the other hand, In breakfast and snack experience a constant consumption accounted for 14%.
In contrast, the biggest portion of saturated fast is consumed in dinner that is 37%, While it is less consumed in breakfast almost 16%, on the other side, in lunch and snacks is consume by 21% and 26%.
The most dramatic change seen in added sugar which is highly consuming in snacks is 42 %, In contrary,it is less consumed in breakfast about 16%. In lunch and dinner the added sugar percentage is 19% and 23%.
AI examiner evaluation
| Criterion | Band |
|---|---|
| Task Achievement / Task Response | 7.0 |
| Coherence and Cohesion | 6.5 |
| Lexical Resource | 5.5 |
| Grammatical Range and Accuracy | 5.0 |
| Overall | 6.0 |
Task Achievement / Task Response: Band 7.0
You identify the main contrasts accurately: dinner has the highest shares of sodium and saturated fat, while snacks lead for added sugar. The overview also notes breakfast’s comparatively low figures, and the body includes relevant values for all three nutrients. This gives the report a clear, well-supported account of the chart’s key features. To make the coverage more precise, avoid describing nutrients as “consumers” or saying they are “consumed” in a meal; report the percentages as shares of each nutrient’s total. Also clarify the saturated-fat figures: lunch is 26% and snacks 21%, but the response reverses these values in the sentence listing them. Apart from this detail, the main features are addressed clearly, though some comparisons could be expressed more precisely.
Coherence and Cohesion: Band 6.5
The response has a clear overall structure: an introduction, an overview, and separate paragraphs for sodium, saturated fat, and added sugar. This makes the information easy to locate, and transitions such as “In contrast” help signal a change of topic. However, linking phrases are sometimes mechanical or awkward, including repeated “on the other side” and “In contrary,” and several sentences run together without consistent spacing or punctuation. The saturated-fat paragraph also presents the lunch and snack figures in an order that conflicts with the chart, which weakens the progression of that comparison. Use simpler, more precise links and keep each comparison in a consistent order to make cohesion more natural.
Lexical Resource: Band 5.5
You use relevant chart vocabulary, including “proportion,” “accounted for,” “largest,” and “dramatic change,” so the reader can generally understand the comparisons. However, a narrow set of expressions is repeated, especially “consumed” and “consumer,” and several combinations are unnatural: “largest consumer of food in dinner time” and “highly consuming in snacks.” “Saturates fats” and “saturated fast” also show inaccurate word forms or spelling. These choices sometimes make the meaning less clear, even though the intended comparisons can usually be inferred. Build a more precise range for describing chart shares, and check collocations and spelling before using less familiar expressions.
Grammatical Range and Accuracy: Band 5.0
You attempt a range of sentence forms, including contrast clauses and sentences with additional comparisons, but control is inconsistent. For example, “The pie chart illustrate” has subject–verb disagreement, while “the average percentage … in typical meals consuming” has an incorrect verb form and an incomplete grammatical pattern. Other problems include missing articles or prepositions in phrases such as “in breakfast” and “in dinner,” and inconsistent capitalisation after commas. Some sentences are also joined with commas where a full stop or conjunction is needed. These errors recur and can make the relationships between figures harder to follow. Practise accurate simple comparison sentences first, then add subordinate clauses while checking agreement, articles, and punctuation.
See this exact question answered at other band scores. The same prompt compared across bands.
Browse more IELTS Writing model answers or get your own writing scored by the same AI examiner.