Band 6.0 IELTS Writing Task 1 Model Answer
Overall Band Score: 6.0 · Cambridge IELTS 14 · 2026-11-11
IELTS Writing Task 1 question
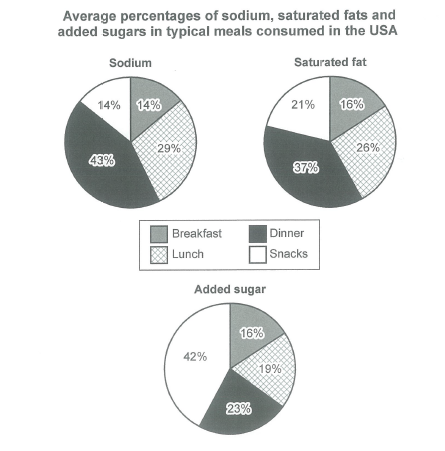
The charts below show the average percentages in typical meals of three types of nutrients, all of which may be unhealthy if eaten too much.
Summarize the information by selecting and reporting the main features, and make comparisons where relevant.
Student answer (Band 6.0)
The three pie charts compare the average proportion of sodium, saturated fats, and added sugar in the typical meals consumed by the USA citizens.
Overall, it is evident that the largest amount of nutrients consumed by the USA citizens is at dinner, except for added sugar, while at breakfast the least amount has consumed. Meanwhile, Snacks has the highest percentage of added sugar consumed by the rasidants of the USA.
Looking at the charts in more detail, it is clear that dinner has the highest percentage of sodium and saturated fats about 43% and 37%, respectively consumed by the USA citizens, while added sugar is obtained at snacks , which is the highest figure (42%). 29%, 26% and 19% of sodium, saturated fats, and addede sugar has consumed by the people of the USA is at lunch.
Turning to the reamining categories, the lowest share of nutrients consumed at breackfast, which accounted for 14% of sodium and 16% of satuarated fats and added sugar. At snacks, 14% and 21% share of sodium and saturated fats, while only 23% added sugar accounted for dinner.
AI examiner evaluation
| Criterion | Band |
|---|---|
| Task Achievement / Task Response | 6.5 |
| Coherence and Cohesion | 6.0 |
| Lexical Resource | 5.5 |
| Grammatical Range and Accuracy | 5.5 |
| Overall | 6.0 |
Task Achievement / Task Response: Band 6.5
You identify the main pattern accurately: dinner has the highest shares of sodium and saturated fat, while snacks lead for added sugar. The overview also notes breakfast’s low figures, and the body includes the key percentages for all four meal categories, with the reported values matching the chart. This gives the response a clear, relevant account of the data. Some comparisons are less fully expressed, however: the overview says dinner has the “largest amount of nutrients,” which is too broad because added sugar peaks at snacks, and the lunch figures are listed without explaining how they compare with other meals. A more precise overview and clearer comparisons across categories would make the key features more fully developed.
Coherence and Cohesion: Band 6.0
The response has a recognisable structure: an introduction, an overview, and two paragraphs presenting details. Phrases such as “Overall,” “Looking at the charts in more detail,” and “Turning to the remaining categories” help signal the stages of the report. However, some links between ideas are mechanical, and the final paragraph’s sequence of figures makes the comparisons harder to follow. For example, the sentence beginning “At snacks, 14% and 21%...” shifts abruptly from breakfast to snacks and then dinner. Grouping the figures consistently by meal or by nutrient, and using clearer references between sentences, would improve progression and cohesion.
Lexical Resource: Band 5.5
You use relevant chart vocabulary, including “proportion,” “percentage,” “highest,” “lowest,” and “accounted for,” so the topic is generally clear. There is some repetition of “consumed” and “percentage,” and several word-choice or collocation problems reduce precision: “largest amount of nutrients” is not an accurate description of the chart’s percentages, while “added sugar is obtained at snacks” sounds unnatural. Spelling errors such as “rasidants,” “addede,” “reamining,” “breackfast,” and “satuarated” also detract from control. Aim for precise terms such as “share” or “proportion,” and check spelling and natural collocations when editing.
Grammatical Range and Accuracy: Band 5.5
You attempt a mix of simple and more complex forms, including the contrast in “while at breakfast...” and the relative clause “which is the highest figure.” The main information remains understandable, but some grammatical errors recur. For example, “the least amount has consumed” needs a passive form such as “the lowest proportions are recorded,” and “29%, 26% and 19% ... has consumed” has subject–verb agreement and sentence-structure problems. The phrase “the lowest share of nutrients consumed at breakfast” is also missing a main verb. Work on complete clauses, passive constructions for chart descriptions, and agreement with plural subjects; these changes would make your comparisons clearer and more accurate.
See this exact question answered at other band scores. The same prompt compared across bands.
Browse more IELTS Writing model answers or get your own writing scored by the same AI examiner.