Band 5.0 IELTS Writing Task 1 Model Answer
Overall Band Score: 5.0 · Cambridge IELTS 14 · 2026-11-12
IELTS Writing Task 1 question
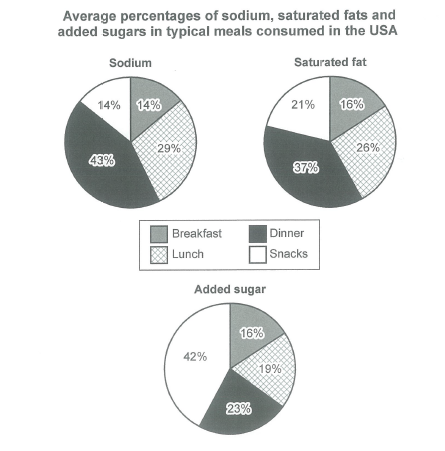
The charts below show the average percentages in typical meals of three types of nutrients, all of which may be unhealthy if eaten too much.
Summarize the information by selecting and reporting the main features, and make comparisons where relevant.
Student answer (Band 5.0)
The graph show the apperoximate of percentage of sodium added sugar saturated fats in typical foods eaten in USA
the first graph show that percentage of breakfast eaten in USA which is 14% and percentage of lunch was 29% and percentage of dinner was 43% and the last the chart give the percentage of snacks which is 14%
the second chart show that percentage of saturated consume in USA
so the breakfast percentage is 16% ,the percentage of lunch is 26% ,and percentage of dinner as 37%, in last graph show percentage of snacks is 21%
And the last chart give the information about average percentage of added sugar in food eaten in USA
so the breakfast percentage is 16% and the lunch peercentage was 19% and dinner percentage was 23% and the last one snacks percentage is 42% so the pie chart give the information about approximate percentage of food eaten in usa
AI examiner evaluation
| Criterion | Band |
|---|---|
| Task Achievement / Task Response | 4.5 |
| Coherence and Cohesion | 5.0 |
| Lexical Resource | 5.0 |
| Grammatical Range and Accuracy | 4.5 |
| Overall | 5.0 |
Task Achievement / Task Response: Band 4.5
You report most of the chart figures accurately, including dinner’s 43% share of sodium and snacks’ 42% share of added sugar. However, the response mainly lists values and does not clearly summarise the most important comparisons. It also lacks a distinct overview identifying the main patterns: dinner is highest for sodium and saturated fat, while snacks lead for added sugar; breakfast is the lowest or joint-lowest across the nutrients. The opening description is unclear about what the percentages represent, and the final sentence repeats the general topic rather than drawing a conclusion from the data. To strengthen the response, give a concise overview first, then select and compare the key highs and lows across all three charts.
Coherence and Cohesion: Band 5.0
The information is presented in a broadly understandable order: sodium, saturated fat, and then added sugar. This gives the reader a basic route through the three sets of figures. However, the response has no paragraph breaks, and its progression is largely a sequence of repeated lists rather than a clearly organised summary. Connectors such as “so” and “and the last” are used repeatedly and do little to show meaningful comparisons between meals or nutrients. The final sentence also repeats the introduction instead of concluding the report. Use separate paragraphs for an overview and the detailed comparisons, and link related patterns—for example, contrasting dinner’s high sodium and fat shares with snacks’ high sugar share.
Lexical Resource: Band 5.0
The response uses a small set of relevant terms, including “percentage,” “breakfast,” “lunch,” “dinner,” and “snacks,” so the chart categories are generally identifiable. However, vocabulary is repetitive and some word choices make the meaning unclear. “The approximate of percentage” is not a natural way to describe the chart, while “percentage of breakfast eaten” suggests a share of meals rather than the nutrient’s contribution in each meal. There are also spelling errors such as “apperoximate” and “peercentage.” Use precise chart language such as “the proportion of sodium in dinner” or “accounted for 43%,” and vary reporting verbs with “shows,” “represents,” and “constitutes.”
Grammatical Range and Accuracy: Band 4.5
Most of the response consists of simple clauses, and the repeated pattern “the percentage of … is/was” allows the reader to follow many of the figures. However, grammatical control is weak and errors occur throughout. For example, “The graph show” has subject–verb disagreement, and “the second chart show” repeats this problem. Several sentences are joined without clear punctuation, as in the long sequence beginning “so the breakfast percentage is 16%,” which makes the relationships between ideas harder to follow. Articles and sentence boundaries are also inconsistent. Practise forming complete sentences with a clear subject and verb, and use full stops to separate each chart’s information. A wider range of accurate comparison structures would also improve clarity.
See this exact question answered at other band scores. The same prompt compared across bands.
Browse more IELTS Writing model answers or get your own writing scored by the same AI examiner.