Band 5.5 IELTS Writing Task 1 Model Answer
Overall Band Score: 5.5 · Cambridge IELTS 14 · 2026-11-17
IELTS Writing Task 1 question
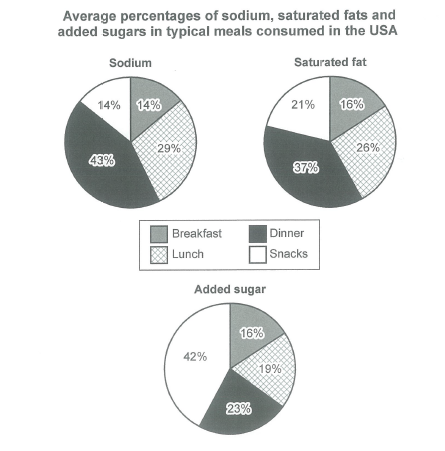
The charts below show the average percentages in typical meals of three types of nutrients, all of which may be unhealthy if eaten too much.
Summarize the information by selecting and reporting the main features, and make comparisons where relevant.
Student answer (Band 5.5)
The three different charts illustrate the average percentage of nutrients specificaly sodium, saturated fats, and added sugars, in typical meals consumed in the USA, which may be unhealthy if consumed too much.
Overall, it can be seen that all the nutrients are consumed in large amounts in the dinner section; however, we see a big change in snacks in added sugar, whereas in lunch the number remained the same.
Firstly, if we see in the left side of the chart the large amounts of nutrients taken in the dinner section, where in sodium the number is 43% and in saturated fats it is 37%, but the number dropped in added sugar which less than a quarter.
However, the snacks section started from 14% in first chart and in second chart it is less than a quarter, whereas the number increased in added sugar for over 42%.
Breakfast showed some fluctuation but remained almost the same from first chart 14% than it remained the same in last two charts.
AI examiner evaluation
| Criterion | Band |
|---|---|
| Task Achievement / Task Response | 5.5 |
| Coherence and Cohesion | 5.5 |
| Lexical Resource | 5.5 |
| Grammatical Range and Accuracy | 5.5 |
| Overall | 5.5 |
Task Achievement / Task Response: Band 5.5
You identify the main pattern that dinner has the highest shares of sodium and saturated fat, and that snacks are especially high in added sugar. The figures of 43%, 37%, and 42% are accurate, and you also note that dinner’s added-sugar share is below a quarter. However, coverage is partial: the claim that lunch “remained the same” is unclear and inaccurate, since its values differ across nutrients (29%, 26%, and 19%). Breakfast is also misreported: it is 14% for sodium and 16% for both other nutrients, not 14% followed by the same value in the last two charts. A clearer overview and more precise comparisons across all four meals would make the report more complete.
Coherence and Cohesion: Band 5.5
The response has a recognisable structure, beginning with an introduction and overview before moving to details about dinner, snacks, and breakfast. This gives the reader some organisation, and transitions such as “Firstly” and “However” signal movement between points. However, progression is not consistently clear: “if we see in the left side of the chart” does not explain which data are being compared, and the reference to lunch in the overview is not developed in the body. The repeated use of “the number” also makes it difficult to track which nutrient or meal is meant. Organise the details by meal or by nutrient, and use explicit references such as “the sodium figure” to improve cohesion.
Lexical Resource: Band 5.5
You use relevant topic vocabulary, including “sodium,” “saturated fats,” “added sugars,” and “fluctuation,” so the subject is generally clear. However, the range is limited and several expressions are imprecise or informal for a data report. “Large amounts” is not a natural way to describe percentages, while “big change” and repeated “the number” do not specify the trend or measure accurately. There is also a spelling error in “specificaly.” Aim for precise terms such as “proportion,” “share,” “rose,” and “accounted for,” and vary the wording used to describe figures. More accurate collocations would make comparisons clearer and more academic in tone.
Grammatical Range and Accuracy: Band 5.5
You attempt a mixture of sentence forms, including a complex opening with “which may be unhealthy if consumed too much” and contrastive clauses. However, control is uneven, particularly in longer sentences. For example, “where in sodium the number is 43% and in saturated fats it is 37%, but the number dropped…” joins ideas awkwardly, and “the number increased in added sugar for over 42%” has an unclear grammatical relationship between the increase and the figure. In “from first chart 14% than it remained,” the comparison structure is faulty. Use shorter, complete sentences when reporting each comparison, and check articles and sentence boundaries; this will help make the data relationships easier to understand.
See this exact question answered at other band scores. The same prompt compared across bands.
Browse more IELTS Writing model answers or get your own writing scored by the same AI examiner.