Band 4.0 IELTS Writing Task 1 Model Answer
Overall Band Score: 4.0 · Cambridge IELTS 14 · 2026-11-18
IELTS Writing Task 1 question
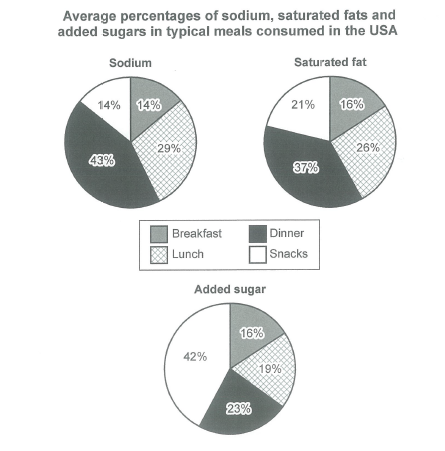
The charts below show the average percentages in typical meals of three types of nutrients, all of which may be unhealthy if eaten too much.
Summarize the information by selecting and reporting the main features, and make comparisons where relevant.
Student answer (Band 4.0)
The pie chart compares the percentage of sodium, saturated fats and added sugar in tyical meals consumed by resident in the USA.
overall,dinner accounted the most percentage of sodium and saturated fat, whereas snacks contain significantly sugar.
Dinner accounted for sodium 43%, saturated fat 37%,whereas 23% sugar is added in dinner
AI examiner evaluation
| Criterion | Band |
|---|---|
| Task Achievement / Task Response | 3.0 |
| Coherence and Cohesion | 4.5 |
| Lexical Resource | 4.5 |
| Grammatical Range and Accuracy | 4.5 |
| Overall | 4.0 |
Task Achievement / Task Response: Band 3.0
You identify the chart’s subject and give a relevant overview that dinner has the highest shares of sodium and saturated fat, while snacks lead for added sugar. The dinner figures you report—43%, 37% and 23%—are accurate. However, the response covers very little of the chart: it omits the breakfast and lunch figures and does not report that snacks account for 42% of added sugar. The summary is also far below the required 150 words, leaving the main comparisons substantially incomplete. To improve, include a fuller overview and compare the meal categories using the key figures, especially the contrast between dinner’s sodium peak and snacks’ added-sugar peak.
Coherence and Cohesion: Band 4.5
The response has a basic progression: it introduces the chart, gives a general comparison, and then provides figures for dinner. The contrast signalled by “whereas” helps connect the main features. However, the answer is extremely brief and its ideas are not developed into a clear, complete summary. The second paragraph repeats the dinner comparison rather than moving on to another meal or nutrient, and the opening overview is separated awkwardly from the following text. Organise the response into a concise introduction, an overview, and a paragraph comparing the key data for the meal categories. Use linking expressions to show contrasts without repeating the same point.
Lexical Resource: Band 4.5
You use relevant chart vocabulary, including “percentage,” “sodium,” “saturated fat,” and “accounted,” so the topic is generally clear. However, the range is narrow, and some word choices or combinations are inaccurate or unnatural: “snacks contain significantly sugar” does not express the chart’s comparison clearly, and “accounted the most percentage” is not a natural collocation. There is also a spelling error in “tyical.” Use precise terms such as “proportion” or “share,” and describe the largest value as “the highest proportion.” A wider range of accurate comparison language would help you report the differences between all four meal types more clearly.
Grammatical Range and Accuracy: Band 4.5
The response attempts both a simple introductory sentence and a more complex comparison using “whereas,” and the main meaning can be understood. However, grammatical control is uneven. In “Dinner accounted the most percentage,” the verb pattern is incomplete; in “Dinner accounted for sodium 43%,” the information is not arranged in a grammatical reporting structure. The sentence beginning “overall” also needs clearer punctuation and capitalisation, while the final sentence lacks a clear structure for presenting the three figures. Practise accurate patterns such as “Dinner accounted for 43% of sodium” and “the proportion of added sugar was 23%.” Varying sentence forms while checking these patterns would improve clarity.
See this exact question answered at other band scores. The same prompt compared across bands.
Browse more IELTS Writing model answers or get your own writing scored by the same AI examiner.