Band 5.0 IELTS Writing Task 1 Model Answer
Overall Band Score: 5.0 · Cambridge IELTS 14 · 2026-11-18
IELTS Writing Task 1 question
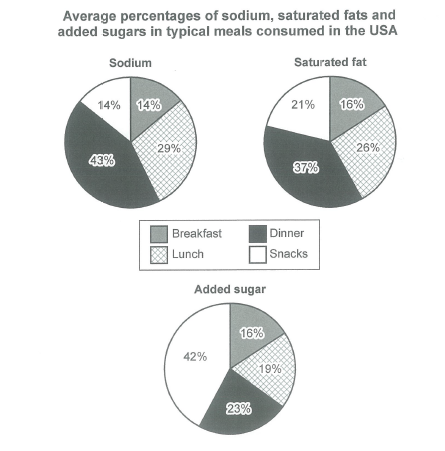
The charts below show the average percentages in typical meals of three types of nutrients, all of which may be unhealthy if eaten too much.
Summarize the information by selecting and reporting the main features, and make comparisons where relevant.
Student answer (Band 5.0)
The given pie chart depicted the information regarding the proportion of consumption pf unhealthy nutrients in the America.
Overall, the highest proportion of sodium and saturated fat is consumed in dinner and added sugar in snacks and all categories taken in lowest percentage in breakfast.
It is clearly seen that the proprtion of sodium, saturated fat and added sugar in dinner was 43%, 37% and 23% which was highest as compared to two other categories. Sodium accounted similar proportion in snacks and breakfast with 14%. Similarly, saturated fat and added sugar just 2% more in breakfast.
Moving further, the percentage of three categories in dinner was 29%, 26% and 19% respectively.
AI examiner evaluation
| Criterion | Band |
|---|---|
| Task Achievement / Task Response | 4.5 |
| Coherence and Cohesion | 5.0 |
| Lexical Resource | 5.5 |
| Grammatical Range and Accuracy | 5.5 |
| Overall | 5.0 |
Task Achievement / Task Response: Band 4.5
You identify the broad pattern that dinner has the largest shares of sodium and saturated fat, while snacks lead for added sugar. However, the report is incomplete and contains a major data-reading error: the final sentence says the dinner figures are 29%, 26% and 19%, but these are the lunch values; dinner is 43%, 37% and 23%. You also omit the key snack figure for added sugar (42%) and do not clearly compare all four meals. The overview is relevant, but the claim that every category is lowest at breakfast is inaccurate because sodium is equally low in breakfast and snacks. The response is also 39 words below the required minimum, limiting the detail provided. Include an accurate overview and select the main comparisons across the charts.
Coherence and Cohesion: Band 5.0
The response has a basic sequence: an introduction, an overview, and two detail statements. Linking phrases such as “Overall” and “Moving further” show an attempt to guide the reader. However, the progression is not clear because the final sentence repeats figures already associated with dinner and labels them incorrectly, rather than developing a comparison of the remaining meals. The detail paragraph also combines several figures without explaining their relationships, and there is no clear separation of the sodium, fat and sugar patterns. Organise the report into a concise overview followed by logically grouped comparisons, and use references such as “by contrast” or “whereas” to make the relationships explicit.
Lexical Resource: Band 5.5
You use some task-relevant vocabulary, including “proportion,” “consumption,” and “accounted,” and the reader can generally understand the topic. However, the range is limited and several choices or forms are inaccurate: “proportion of consumption pf unhealthy nutrients” is awkward, while “taken in lowest percentage” does not express the chart information naturally. “Two other categories” is also imprecise when comparing meal types. Spelling errors such as “proprtion” and “pf” reduce accuracy. Aim for precise chart language, for example “the share of sodium in each meal” and “the lowest proportion,” and check spelling before submitting. Vary verbs such as “accounted for,” “represented,” and “made up” appropriately.
Grammatical Range and Accuracy: Band 5.5
You attempt both simple and more extended sentence forms, and the main message is usually recoverable. However, control is uneven. The opening sentence lacks a natural grammatical construction (“depicted the information regarding…”), and the overview has a faulty structure: “all categories taken in lowest percentage in breakfast” is missing a clear verb and does not form a complete clause. In “saturated fat and added sugar just 2% more in breakfast,” the comparison also lacks a finite verb. Tense and agreement are inconsistent, as in “is consumed” followed by “was.” Use complete clauses with clear subjects and verbs, and keep tense consistent when describing the chart. More accurate sentence patterns would make the comparisons easier to follow.
See this exact question answered at other band scores. The same prompt compared across bands.
Browse more IELTS Writing model answers or get your own writing scored by the same AI examiner.