Band 5.0 IELTS Writing Task 1 Model Answer
Overall Band Score: 5.0 · Cambridge IELTS 14 · 2026-11-19
IELTS Writing Task 1 question
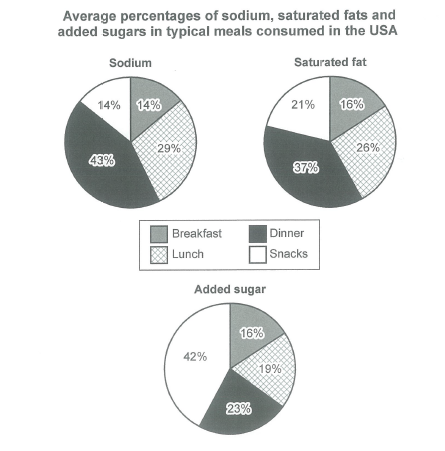
The charts below show the average percentages in typical meals of three types of nutrients, all of which may be unhealthy if eaten too much.
Summarize the information by selecting and reporting the main features, and make comparisons where relevant.
Student answer (Band 5.0)
The given chart show the average percentages in typical meals of three types of nutrients, all of which may be unhealthy if eaten too much.
There are 3 different pie-charts illustrating average percantages of sodium ,saturated fats,and added sugars consumed during different types of meals that are basically,breakfast,snacks,lunch and dinner.During breakfast the sodium is consumed 14%,and in snacks 14%, in lunch 29%,in dinner 43%. whereas, fats are 16% in breakfast ,21 in snacks,26 in lunch and 37 in dinner.
likewise sugars are consumed 42 in snacks ,16 in breakfast,19 in lunch,and 23 in dinner.Overall, the total in all nutrients is 100% ,which is likely dangerous for health.Sodium,fats and sugar are unhealthy for one's body.Overall consuming more types of nutrients causes many problems which may lead to, obesity,sugar,heart problems, unproper functioning of body organs, ,liver,lungs,etc.
Hence,controlling of nutrients such as sodium,fats,and sugar should be done ,and making a diet could help for a good health and lifestyle.
AI examiner evaluation
| Criterion | Band |
|---|---|
| Task Achievement / Task Response | 4.5 |
| Coherence and Cohesion | 5.0 |
| Lexical Resource | 5.0 |
| Grammatical Range and Accuracy | 5.0 |
| Overall | 5.0 |
Task Achievement / Task Response: Band 4.5
You report the figures for all three nutrients accurately, including dinner as the largest source of sodium and saturated fat and snacks as the largest source of added sugar. However, the response does not provide a clear, data-focused overview of these main patterns: the statement that all nutrients total 100% is not a useful comparison, and the health advice and claims about obesity and organ problems are not shown by the charts. The task is only partly addressed because the key comparisons are embedded in a list rather than summarised and selected. The response also contains 134 words, below the required 150; 22 words copied from the task prompt were not counted. Add a concise overview and develop the most important comparisons without introducing unsupported conclusions.
Coherence and Cohesion: Band 5.0
There is some organisation: the response introduces the charts, reports sodium and fat figures, then gives the sugar figures and a concluding comment. Basic linking words such as “likewise,” “whereas” and “hence” show an attempt to connect ideas. However, progression is weakened by presenting many figures in one long paragraph and then shifting from chart description to general health advice. “Overall” is repeated, and the relationship between the data and the claims that follow is unclear. Use separate paragraphs for an overview and the detailed comparisons, and group related figures consistently. This would make the information easier to follow and reduce the reliance on simple or repetitive transitions.
Lexical Resource: Band 5.0
The response uses enough topic vocabulary to identify the chart categories, including “sodium,” “saturated fats,” “added sugars” and “percentages.” Some wording also attempts to describe the data, such as “consumed during different types of meals.” However, the range is limited and several choices or forms are inaccurate or awkward, including “percantages,” “unproper functioning,” and “controlling of nutrients.” The health-related vocabulary is also imprecise and not needed to describe the visual information. Aim for accurate chart language such as “accounted for,” “proportion” and “highest share,” and check spelling and natural collocations. More precise vocabulary would help you compare the figures without adding unsupported claims.
Grammatical Range and Accuracy: Band 5.0
You use some simple sentences and attempt longer structures, for example, “There are 3 different pie-charts illustrating…” and the comparison beginning “whereas.” However, the range is limited, and errors occur frequently enough to make parts of the response awkward to read. Examples include “The given chart show,” where the subject and verb do not agree, and “During breakfast the sodium is consumed 14%,” which has an unclear grammatical pattern. Several figures are presented as fragments rather than complete, parallel clauses. Punctuation and spacing around commas are also inconsistent. Practise accurate comparison structures such as “Dinner accounts for 43% of sodium intake, compared with 14% at breakfast,” and proofread agreement, articles and sentence boundaries.
See this exact question answered at other band scores. The same prompt compared across bands.
Browse more IELTS Writing model answers or get your own writing scored by the same AI examiner.