Band 4.0 IELTS Writing Task 1 Model Answer
Overall Band Score: 4.0 · Cambridge IELTS 14 · 2026-11-20
IELTS Writing Task 1 question
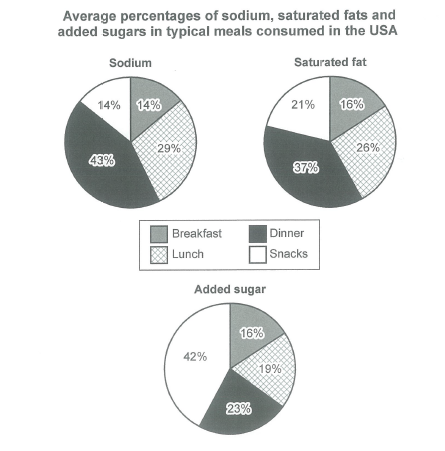
The charts below show the average percentages in typical meals of three types of nutrients, all of which may be unhealthy if eaten too much.
Summarize the information by selecting and reporting the main features, and make comparisons where relevant.
Student answer (Band 4.0)
The pie charts depict the proportion of sodium,saturated fat and added sugar in four types of meals .
overall,it is clear that added suagr accounted for the maximum percentage in the snacks.however,in the lunch t,he figure was least for every nutrient .
AI examiner evaluation
| Criterion | Band |
|---|---|
| Task Achievement / Task Response | 3.0 |
| Coherence and Cohesion | 4.5 |
| Lexical Resource | 4.5 |
| Grammatical Range and Accuracy | 4.5 |
| Overall | 4.0 |
Task Achievement / Task Response: Band 3.0
You identify the chart topic and attempt an overview, noting that added sugar is highest in snacks. However, the claim that lunch is the lowest for every nutrient is inaccurate: breakfast has the lowest sodium share (14%), while breakfast is also the lowest for saturated fat (16%) and added sugar (16%); lunch is not the minimum for any of these. The response gives no accurate supporting figures or meaningful comparisons, so it reports only a very small part of the visual information. It is also substantially below the required 150 words, leaving the task minimally addressed. To improve, give a clear overview based on the actual highs and lows, then compare the meal categories with selected figures for all three nutrients.
Coherence and Cohesion: Band 4.5
The response has a basic two-sentence structure: an opening identifies the charts, followed by an overview introduced with “overall.” This gives the reader a simple starting point, but there is no further progression because the response ends before presenting detailed comparisons. The contrast marker “however” does not clearly connect the two claims, and the second claim is also factually mistaken. Develop the response in a logical sequence: introduce the charts, summarise the main patterns, and then group relevant comparisons in a detail paragraph. Use linking words only where the relationship between ideas is clear, and check punctuation and spacing so the organisation is easier to follow.
Lexical Resource: Band 4.5
You use a few relevant terms, including “proportion,” “sodium,” “saturated fat,” “added sugar,” and “percentage,” which show awareness of the chart topic. However, the vocabulary range is narrow and the response repeats general wording rather than describing differences precisely. There are also spelling errors in “suagr” and the malformed phrase “lunch t,he,” while “maximum percentage” is less natural than “largest share” in this context. Build a small set of accurate chart-description phrases, such as “accounted for,” “was highest in,” and “compared with,” and use them to report specific values. Proofreading spelling and word choice would make the limited information clearer.
Grammatical Range and Accuracy: Band 4.5
The response uses simple sentence forms, including “The pie charts depict…” and “it is clear that…,” and the basic meaning is generally understandable. However, there is little variety in sentence structure, and punctuation and spacing are inconsistent: the opening has extra spaces, while “overall,it” lacks a space after the comma and the second sentence contains a misplaced comma in “lunch t,he.” The phrase “in four types of meals” also needs an article before “four” in this construction. Practise writing complete comparison sentences with accurate articles and punctuation, for example, “Dinner accounts for the largest share of sodium, whereas snacks contribute the most added sugar.”
See this exact question answered at other band scores. The same prompt compared across bands.
Browse more IELTS Writing model answers or get your own writing scored by the same AI examiner.