Band 6.0 IELTS Writing Task 1 Model Answer
Overall Band Score: 6.0 · Cambridge IELTS 14 · 2026-11-06
IELTS Writing Task 1 question
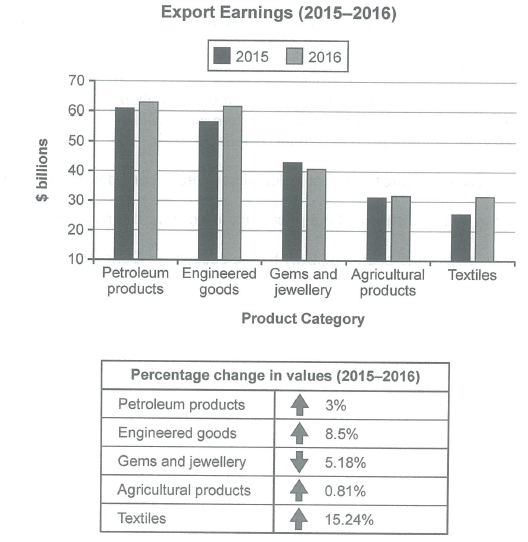
The chart below shows the value of one country’s exports in various categories during 2015 and 2016. The table shows the percentage change in each category of exports in 2016 compared with 2015.
Summarise the information by selecting and reporting the main features, and make comparisons where relevant.
Student answer (Band 6.0)
The importance of one country's exports in various categories in 2015 and 2016 was depicted by the bar graph.The table chart illustrates the percentile change in each category of exports in 2016 compared with 2015.
overall,it can be noticed that petroleum products were exported the most in both years,whereas the maximum percentage change in value is in textiles sector.
It is crystal clear from the bar graph that from exports, the petroleum products earned morer in both years [61% and 63%],respectively.Then 55% earned from engineered goods in 2015 and 61% in 2016.Afterthat,gems and jewellery earned 43% in 2015 and 41% in 2016.In 2015,agricultural products earned 31%,while textiles earned 25%.Finally,in the next year,they both bearned same ration [32%].
Turning towards the table chart,in [redacted phone],yhe percentile of petroleum products and engineered goods increased by[ 3% and 8.5%],respectively.The highest percent oncreased in textiles sector with the figure of 15.24%,while the ratio in gems and jewellery went down by 5.18%.Lastly,the percentage of agricultural products rise minimallu by 0.81%.
AI examiner evaluation
| Criterion | Band |
|---|---|
| Task Achievement / Task Response | 6.5 |
| Coherence and Cohesion | 6.0 |
| Lexical Resource | 5.5 |
| Grammatical Range and Accuracy | 5.5 |
| Overall | 6.0 |
Task Achievement / Task Response: Band 6.5
You cover the main features and provide a clear overview: petroleum products lead in both years, while textiles show the largest percentage increase. Most figures and trends are reported accurately, including the decline in gems and jewellery and the small rise in agricultural products. However, there are some inaccuracies: engineered goods are about $57 billion in 2015 and $62 billion in 2016, not 55% and 61%; the chart reports export values in billions of dollars, not percentages. The final-year figures for agriculture and textiles are approximately $31.5 billion each. This response meets the task well and includes relevant comparisons, but more precise units and closer reporting of the chart values would make the account more complete and accurate.
Coherence and Cohesion: Band 6.0
The response has a recognisable structure: an introduction, an overview, a paragraph describing the bar chart, and a final paragraph on percentage changes. This gives the reader a generally coherent route through the information. Linking expressions such as “whereas,” “Then,” and “Turning towards” help signal comparisons and the shift between visuals. However, some transitions feel mechanical, and the sequence within the chart paragraph is not always smooth. The reference “they both” is also unclear without rereading to identify the two categories. Use clearer paragraphing and more direct links between related comparisons—for example, group the two leading categories, then the lower-valued categories—to make progression more controlled and cohesion less dependent on formulaic transitions.
Lexical Resource: Band 5.5
You use relevant task vocabulary, including “exports,” “percentage change,” “increased,” and “went down,” and you attempt alternatives such as “earned” and “ratio.” However, several choices are inaccurate or unnatural for describing this chart. “Percentile change” is not the intended term, and “petroleum products were exported the most” describes quantity rather than export value. There are also noticeable spelling errors, including “morer,” “yhe,” “oncreased,” and “minimallu,” which reduce the polish of the report. Aim for precise chart language and check spelling carefully. Phrases such as “export earnings,” “stood at,” and “rose by” would express the data more naturally and accurately.
Grammatical Range and Accuracy: Band 5.5
You attempt a mix of simple and more complex forms, including the contrast in “whereas the maximum percentage change…” and the time comparison “in 2015… while…”. The overall meaning is usually understandable, but some grammatical errors and punctuation problems remain. For example, “they both bearned same ration” has an incorrect verb form and lacks an article, while “the percentage of agricultural products rise” does not maintain past tense. Several sentences also run directly into the next without a space after the full stop, and commas are inconsistently placed. Practise accurate past-tense reporting and sentence boundaries, and proofread articles and verb forms. These improvements would make your varied sentence attempts more controlled.
See this exact question answered at other band scores. The same prompt compared across bands.
Browse more IELTS Writing model answers or get your own writing scored by the same AI examiner.