Band 5.5 IELTS Writing Task 1 Model Answer
Overall Band Score: 5.5 · Cambridge IELTS 14 · 2026-11-06
IELTS Writing Task 1 question
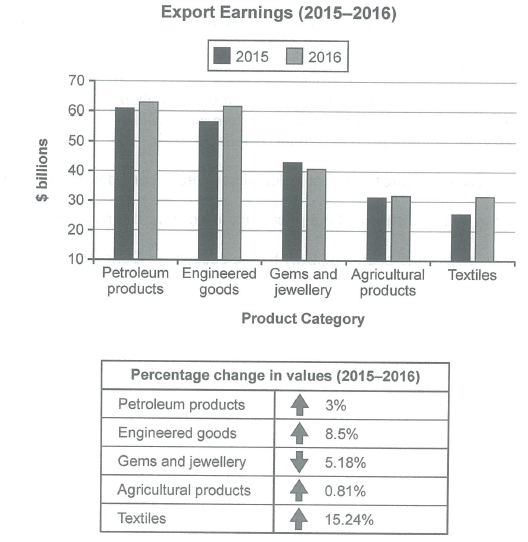
The chart below shows the value of one country’s exports in various categories during 2015 and 2016. The table shows the percentage change in each category of exports in 2016 compared with 2015.
Summarise the information by selecting and reporting the main features, and make comparisons where relevant.
Student answer (Band 5.5)
The bar and table charts illustrate the export earnings and the proportion change fives categories in 2015 and 2016
Overall, petroleum productus was in dominant mode in both years, while textiles and engineered goods showed significant growth. In contast, gems and jewellery follwed a downward trend.
Regarding first graph, earnings came from petroleum products was highest in both year, in 2015 roughly at $61 billions to $62 billions. Engineered goods ranked second, rose to %61 billions by 2016. Textiles showed dramatic growth, it increased nearly at $27 billions to $31 billions and erning grew in agricultural products slightly, made up $31 billions. In comparison, germs and jewellary experienced drcrease among all categories, fell to about $41 billions in 2015.
The proportion of testiles products acounted the highest share, at 15.24% over the period.
AI examiner evaluation
| Criterion | Band |
|---|---|
| Task Achievement / Task Response | 5.0 |
| Coherence and Cohesion | 5.5 |
| Lexical Resource | 5.5 |
| Grammatical Range and Accuracy | 5.0 |
| Overall | 5.5 |
Task Achievement / Task Response: Band 5.0
You identify the broad pattern that petroleum products earned the most and that textiles grew strongly, and you note the decline in gems and jewellery. However, the report covers the data only partially and includes important inaccuracies: engineered goods rose to about $62 billion, not $61 billion; gems and jewellery fell to about $41 billion in 2016, not 2015; and the petroleum figure is given as a range rather than clearly comparing both years. The table’s other changes are largely omitted, and the overview does not summarise the full set of trends. The response is also below the required 150 words. To improve, report the key figures accurately for both years and include the main percentage changes, especially the contrast between textiles’ largest rise and gems’ fall.
Coherence and Cohesion: Band 5.5
The response has a basic report structure: an introduction, an overview, and a paragraph describing chart details, followed by a sentence about the table. This gives the reader some sense of organisation. However, the progression is uneven: the final table point is isolated, and the body moves between categories without a consistently clear comparison. Linking phrases such as “In contrast” and “Regarding first graph” show an attempt to connect ideas, but some are awkward or do not clearly signal the relationship. Grouping the categories by trend—for example, the strongest increases together and the decline separately—and integrating the table figures with the chart discussion would make the report more coherent and cohesive.
Lexical Resource: Band 5.5
You use some relevant chart vocabulary, including “export earnings,” “ranked second,” “dramatic growth,” and “downward trend,” which helps communicate the main patterns. However, the range is limited and several spelling and word-choice errors make parts of the report less clear, such as “proportion change,” “productus,” “contast,” “germs,” and “acounted.” Some expressions are also unnatural for describing data: “was in dominant mode” and “the proportion of textiles products accounted the highest share” are not idiomatic. Aim for precise, conventional reporting language and check spelling carefully. For example, use “percentage change,” “recorded the highest earnings,” and “textiles showed the largest percentage increase.”
Grammatical Range and Accuracy: Band 5.0
The response attempts a few complex structures, including “while textiles and engineered goods showed significant growth” and “In comparison, gems and jewellery experienced a decrease.” However, sentence structures are often faulty, and errors sometimes make the intended comparison difficult to follow. Examples include “earnings came from petroleum products was highest,” which lacks a workable clause structure, and “it increased nearly at $27 billions to $31 billions,” where the verb pattern and comparison are not controlled. There are also problems with articles, agreement, and plurals, as in “in both year” and “$61 billions.” Use simpler, accurate sentence patterns first, then add controlled comparisons such as “rose from … to …” and “was higher than …”.
See this exact question answered at other band scores. The same prompt compared across bands.
Browse more IELTS Writing model answers or get your own writing scored by the same AI examiner.