Band 6.0 IELTS Writing Task 1 Model Answer
Overall Band Score: 6.0 · Cambridge IELTS 14 · 2026-11-08
IELTS Writing Task 1 question
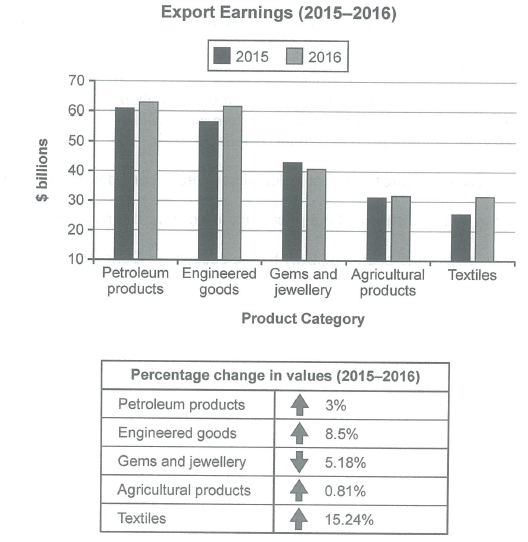
The chart below shows the value of one country’s exports in various categories during 2015 and 2016. The table shows the percentage change in each category of exports in 2016 compared with 2015.
Summarise the information by selecting and reporting the main features, and make comparisons where relevant.
Student answer (Band 6.0)
The given bar chart illustrates that export earnings of one country during 2015 and 2016, and the below table chart depicts percentage change in values during 2015 and 2016. There are various products considered for country's export income such as petroleum products, engineered goods, gems and Jwellery, agricultural products and textiles.
Overall, country's earnings are the highest in export of petroleum products and engineered goods compared to other items, 2015 and 2016 both years accounted higher earnings. However, textiles goods export earnings considerably much lower. The table chart depicts change in values of export goods from 2015 to 2016. It is clearly showed the downward trend in gems and jewellery, other all products export values are increased in one year.
According to bar chart export earnings from petroleum, engineered goods are 60 billions and 58 billions respectively in 2015. Earnings are increased in 2016 by 3% and 8.5% percentage and in numbers 62 billions and 61 millions respectively. Agricultural products export earning relatively same in 2015 and 2016, which is around 31 billion dollars. Only 0.81% values increased in one year. Textile export earning is the lowest number in 2015, 26 billions, it has dramatic increased in 2016 by 15.24%. Total earning from textile export is 31 billions in 2016.
AI examiner evaluation
| Criterion | Band |
|---|---|
| Task Achievement / Task Response | 6.5 |
| Coherence and Cohesion | 6.5 |
| Lexical Resource | 6.0 |
| Grammatical Range and Accuracy | 5.5 |
| Overall | 6.0 |
Task Achievement / Task Response: Band 6.5
You cover the main categories and provide a clear overview: petroleum and engineered goods are among the highest earners, textiles rise substantially, and gems and jewellery decline while the other categories increase. Most reported figures are broadly consistent with the chart, including textiles at about $26 billion and $31 billion and agricultural products at around $31 billion in both years. However, the overview could identify the key comparisons more precisely, especially that petroleum remains the top category and textiles show the largest percentage increase. There is also a significant numerical inconsistency: engineered goods are given as $58 billion in 2015 and “61 millions” in 2016, whereas the chart shows approximately $57 billion and $62 billion. More accurate selection and reporting of figures would strengthen the response further.
Coherence and Cohesion: Band 6.5
The response has a coherent overall arrangement, moving from an introduction to an overview and then to details about the categories. Paragraphing helps the reader distinguish the general picture from supporting figures, and phrases such as “Overall” and “According to bar chart” signal the stages of the report. Some connections are less clear or mechanical, however. For example, “However, textiles goods export earnings considerably much lower” does not clearly explain the comparison, and the final paragraph moves between categories without a fully consistent order. The reference “It is clearly showed” is also difficult to follow. Grouping the largest earners together, then the remaining categories, and using clearer links between comparisons would make the progression more controlled.
Lexical Resource: Band 6.0
You use a relevant range of task vocabulary, including “export earnings,” “percentage change,” “downward trend,” and “dramatic increased,” so the main information is generally understandable. There are also attempts to vary wording, such as “depicts” and “accounted.” However, several word choices and collocations are inaccurate or awkward: “table chart,” “textiles goods,” “earnings are the highest in export of,” and “dramatic increased.” “Jwellery” is misspelled, and “61 millions” uses an unsuitable form for a monetary figure. These errors do not usually prevent understanding, but they reduce precision and naturalness. Aim for standard chart-reporting phrases such as “the table shows,” “textile exports,” and “rose sharply,” and check spelling and number expressions.
Grammatical Range and Accuracy: Band 5.5
You attempt both simple and more complex sentence forms, including comparisons and clauses introduced by “which” and “that.” The overall meaning is usually recoverable, but some grammatical errors remain, and several sentences are not well controlled. For instance, “The given bar chart illustrates that export earnings…” lacks a complete grammatical construction after “illustrates,” while “It is clearly showed” has an incorrect verb form. In “Overall, country's earnings,” the possessive determiner is missing, and “other all products export values are increased” has problems with word order and verb form. There are also issues with articles, plurals, and sentence punctuation. Review these patterns and build complex sentences around accurate subject–verb structures.
See this exact question answered at other band scores. The same prompt compared across bands.
Browse more IELTS Writing model answers or get your own writing scored by the same AI examiner.