Band 6.0 IELTS Writing Task 1 Model Answer
Overall Band Score: 6.0 · Cambridge IELTS 14 · 2026-11-08
IELTS Writing Task 1 question
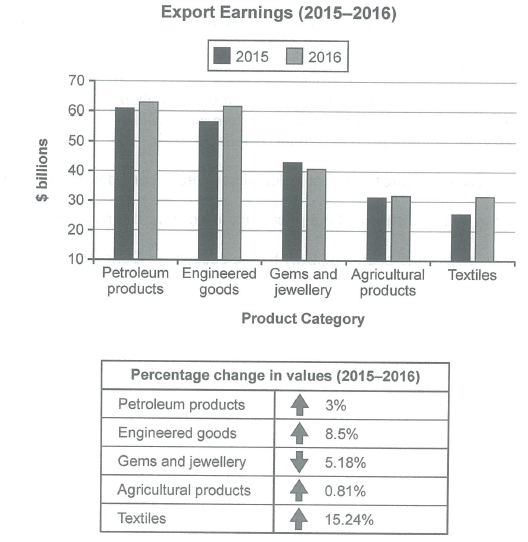
The chart below shows the value of one country’s exports in various categories during 2015 and 2016. The table shows the percentage change in each category of exports in 2016 compared with 2015.
Summarise the information by selecting and reporting the main features, and make comparisons where relevant.
Student answer (Band 6.0)
This bar chart compares a country's export of various categories of products in billions such as Petroleum, Engineered goods, Gems and Jewellery, Agricultural products and textiles during the year 2015 and 2016. The table below that depicts percentage of change in values between 2015 and 2016.
Overall, except Gems and jewelley category all the other products saw a increase in export values in billlions between 2015 and 2016. Petroleum Products had the highest export value both in 2015 and 2016.The table also shows us that except Gems and Jewellery category all the other categories saw a increase in change in values from 2015 to 2016.
Petroleum products were the highest exported category among all the other categories in both 2015 and 2016. They were exported for just over 60 billion in 2015 which increased by 3 percentage in 2016 to around 62 billion. Engineered goods were exported for around 57 billion which rose by 8.5 percentage to around 61 billion in 2016.
Gems and Jewellery were exported for 43 billion in 2015 which saw a 5.18 percentage dip in change in values to just more than 40 billion in 2016. Agricultural products remained almost the same with 31 billion in 2015 to around 32 billion in 2016 . The percentage change in values was around 0.81%. The textile category rose from 25 billion in 2015 to 32 billion in 2016 with a margin percentage increase of 15.24%.
AI examiner evaluation
| Criterion | Band |
|---|---|
| Task Achievement / Task Response | 6.5 |
| Coherence and Cohesion | 6.0 |
| Lexical Resource | 5.5 |
| Grammatical Range and Accuracy | 5.5 |
| Overall | 6.0 |
Task Achievement / Task Response: Band 6.5
You cover the chart and table and give a clear overview: petroleum is the highest-valued export in both years, while gems and jewellery is the only category to decline. Most figures and percentage changes are reported accurately, including the rise in textiles and the near-stability of agriculture. This meets the task well, with some features developed more fully than others. However, the overview repeats that all categories except gems increased without highlighting the most notable contrast: textiles had the largest percentage rise, whereas agriculture changed very little. A few figures are also imprecise: engineered goods are about $62 billion in 2016, not $61 billion, and petroleum is about $63 billion rather than $62 billion. Prioritising the key comparisons and aligning these figures more closely with the chart would strengthen the report.
Coherence and Cohesion: Band 6.0
The response has a coherent overall arrangement: an introduction, an overview, and two paragraphs grouping the higher-valued categories and the remaining categories. This makes the information easy to follow. The progression is sometimes weakened by repetitive phrasing, especially the repeated statement that categories increased, and by mechanical links such as “The table also shows us that.” Some references are also unclear: “which saw a 5.18 percentage dip in change in values” is awkwardly constructed and makes the relationship between the percentage and the 2016 figure less direct. Use concise transitions and organise comparisons around the main patterns—for example, the leading categories, the decline in gems, and the sharp textile rise—to make cohesion more flexible and precise.
Lexical Resource: Band 5.5
You use relevant vocabulary for describing data, including “export values,” “increased,” “dip,” and “remained almost the same,” so the main trends are understandable. However, the range is somewhat repetitive, and several word choices or collocations are inaccurate for formal chart reporting. “Exported for” suggests a transaction rather than the value of exports, while “3 percentage” and “margin percentage increase” are not natural forms. There are also spelling errors in “jewelley” and “billlions,” alongside inconsistent capitalisation of category names. Choose precise reporting language such as “was valued at,” “rose by 3%,” and “percentage increase,” and proofread spelling to improve accuracy and control.
Grammatical Range and Accuracy: Band 5.5
You attempt both simple and more complex sentence forms, including relative clauses such as “which increased by 3 percentage in 2016” and comparisons across years. The overall meaning is generally clear, but some grammatical errors recur. For example, “all the other products saw a increase” has an article error, and “Petroleum Products had the highest export value both in 2015 and 2016” needs clearer punctuation or a linking phrase. The sentence about gems—“which saw a 5.18 percentage dip in change in values to just more than 40 billion”—is structurally difficult to follow. Check articles, sentence boundaries, and clause construction, and use a consistent past-tense pattern when describing the figures.
See this exact question answered at other band scores. The same prompt compared across bands.
Browse more IELTS Writing model answers or get your own writing scored by the same AI examiner.