Band 5.5 IELTS Writing Task 1 Model Answer
Overall Band Score: 5.5 · Cambridge IELTS 14 · 2026-11-10
IELTS Writing Task 1 question
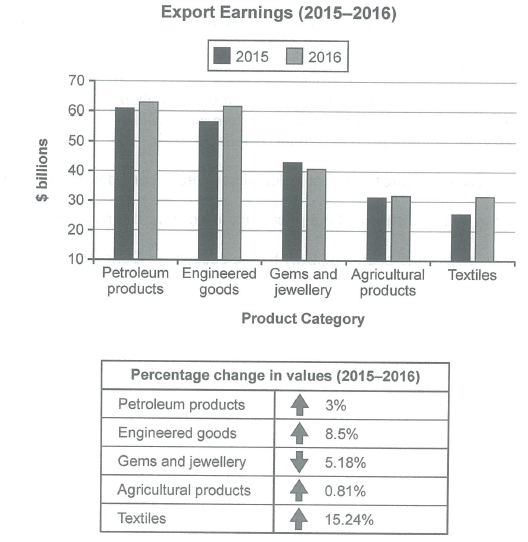
The chart below shows the value of one country’s exports in various categories during 2015 and 2016. The table shows the percentage change in each category of exports in 2016 compared with 2015.
Summarise the information by selecting and reporting the main features, and make comparisons where relevant.
Student answer (Band 5.5)
The bar graph demonstrates the value of one country's export in different categories like petroleum products, engineered goods, gem and jewellery, agricultural products and texiles in two years 2015 and 2016.The tabular illustrates the percentile change in each category of export in 2016 compared with 2015.
Overall, it can be witnessed that petroleum products export greater both years while textiles export was least as compared to other. The highest percentage change in textiles in contrast percentage declined in second year in gem and jewellery.
To commence with, petroleum products export 61 billions in 2015 and 62 billion in 2016. Which was the greater export in the chart. Moreover, engineered goods were exported 58 billions in 2005 and 61 billions in 2016.In agricultural products export remained stable in both years. Furthermore, the export in textiles sector rised in second year.
Further analyzing the table, it can be noticethat petroleum products 3% change in value, engineered goods 8.5%, agricultural products 0.8%, and textiles 15.24%. In gem and jewellery sector percentage dropped as compared to other sectors.
AI examiner evaluation
| Criterion | Band |
|---|---|
| Task Achievement / Task Response | 5.5 |
| Coherence and Cohesion | 5.5 |
| Lexical Resource | 5.5 |
| Grammatical Range and Accuracy | 5.0 |
| Overall | 5.5 |
Task Achievement / Task Response: Band 5.5
You identify the main categories and give a useful overview: petroleum products are the largest export, while textiles show the strongest growth and gems and jewellery decline. However, several details are inaccurate or incomplete. The chart places petroleum at about $61 billion in 2015 and $63 billion in 2016, not $62 billion in 2016; engineered goods are about $57 billion and $62 billion, rather than the figures given. The statement that textiles were the least exported applies only to 2015, since in 2016 textiles and agricultural products are both about $31.5 billion. You also omit the size of the decline in gems and jewellery. More precise comparisons and accurate figures would make the summary more fully informative.
Coherence and Cohesion: Band 5.5
The response has a recognisable structure, moving from an introduction and overview to chart details and then the table. This gives the reader a basic route through the information. However, progression within the body is uneven: the chart discussion jumps from petroleum to engineered goods, then agriculture and textiles, while the gems category is left until a brief final comment. Some linking phrases, such as “To commence with” and “Further analyzing the table,” signal sections but do not create strong connections between the comparisons. The sentence beginning “Which was the greater export” is also detached from the preceding point. Grouping the largest categories together and then comparing the smaller ones, with clearer links between sentences, would improve the flow.
Lexical Resource: Band 5.5
You use some relevant task vocabulary, including “export,” “percentage change,” “remained stable,” and “declined,” so the topic is generally clear. However, the range is limited and several word choices or forms are inaccurate, which sometimes makes the meaning awkward: “percentile change” should be “percentage change,” and “export greater” does not express the comparison naturally. There are also spelling errors such as “texiles” and “noticethat,” and “gem and jewellery” is not consistently expressed as the chart category “gems and jewellery.” Aim for precise reporting verbs and comparison language, such as “rose,” “fell,” “was higher than,” and “accounted for,” while checking spelling and collocations.
Grammatical Range and Accuracy: Band 5.0
The response attempts some longer structures, but sentence control is inconsistent and the range remains limited. Several sentences are incomplete or incorrectly joined: “Which was the greater export in the chart” is a fragment, while “The tabular illustrates…” lacks a natural grammatical subject. There are also problems with articles, plurals, and verb forms, as in “petroleum products export 61 billions” and “the export in textiles sector rised.” Punctuation and spacing are unreliable, particularly where sentences run together after “2016.” These errors sometimes make the relationships between ideas difficult to follow. Practise forming complete subject–verb sentences and use accurate past-tense forms, for example, “Textile exports rose to about $31.5 billion in 2016.”
See this exact question answered at other band scores. The same prompt compared across bands.
Browse more IELTS Writing model answers or get your own writing scored by the same AI examiner.