Band 6.0 IELTS Writing Task 1 Model Answer
Overall Band Score: 6.0 · Cambridge IELTS 14 · 2026-11-10
IELTS Writing Task 1 question
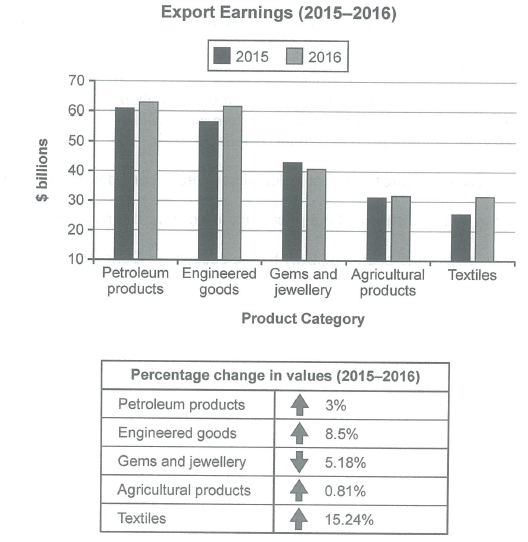
The chart below shows the value of one country’s exports in various categories during 2015 and 2016. The table shows the percentage change in each category of exports in 2016 compared with 2015.
Summarise the information by selecting and reporting the main features, and make comparisons where relevant.
Student answer (Band 6.0)
The bar chart compares the export price of different types of products, while table illustrates the change in percentage values of these types of items in 2015 and 2016. Overall, it is apparent that overseas sale of petroleum products was higher than other categories the textile export was lower in 2015 after that it increased slightly in 2016. However, the percentage value of all products increased expect gems and jewellery industries.
Firstly, the export of petroleum products was nearly 60 billion dollars which was slightly increased to approximately 64 billion dollars while industrials goods export was nearly 57 billion dollars in the next year there was considerable increased in export of engineering fields reached to approximately 61 billion dollars. In contrast, the foreign trade of gems and jewellery from 44 billion dollars to approximately 40 billion dollars in single years. In addition the export of agriculturals products were quite same in both years, while there was significant increased in export of textiles from nearly 25 to approximately 32 billion dollars.
secondly, there was significant increased in percentage change of values in petroleum products, engineered goods,agriculture products and textiles 3%, 8.5%, 0.81%, 15.24% respectively. However, there was 5.18% dropped in values of jewels and jewellery industry.
AI examiner evaluation
| Criterion | Band |
|---|---|
| Task Achievement / Task Response | 6.5 |
| Coherence and Cohesion | 6.0 |
| Lexical Resource | 6.0 |
| Grammatical Range and Accuracy | 5.5 |
| Overall | 6.0 |
Task Achievement / Task Response: Band 6.5
You cover both the chart and the table, and your overview identifies the main contrast: petroleum exports are highest, textiles rise notably, and gems and jewellery are the only category to decline. Most figures and directions are broadly consistent with the visual, including the 15.24% textile increase and 5.18% fall in gems and jewellery. This meets the task well, with some features reported more fully than others. However, the overview is not fully precise: textiles were the lowest category in 2015, but in 2016 they were level with agricultural products, rather than simply increasing “slightly.” Also, the table gives percentage changes, not percentage values, and the chart shows export values rather than prices. Clarifying these points and making the key comparisons more exact would strengthen the response further.
Coherence and Cohesion: Band 6.0
The response has a recognisable structure: an introduction and overview are followed by discussion of the chart and then the table. This gives the reader a coherent overall route through the information, and contrast markers such as “In contrast” and “However” help signal changes. Some links are nevertheless mechanical or unclear. “Firstly” and “secondly” do not explain the relationship between the two data displays, and the long first body paragraph moves through several categories without consistently clear sentence boundaries. The overview also combines several points in a way that makes the comparison slightly difficult to follow. Grouping the chart figures into clearer comparisons—for example, the highest-value categories, the decline, and the near-stable categories—and using more precise referencing would improve progression and cohesion.
Lexical Resource: Band 6.0
You use an adequate range of task-related vocabulary, including “export,” “approximately,” “in contrast,” and “significant,” and the reader can generally understand the comparisons. There are also attempts at varied phrasing, such as “foreign trade” and “overseas sale.” However, several choices are inaccurate or unnatural for this chart: “export price” should refer to export value or earnings, “industrials goods” is not an appropriate category label, and “increased in percentage change” does not express the table’s figures clearly. Some category names are also inconsistent, such as “engineering fields” for engineered goods. Prefer the chart’s own labels and use precise collocations such as “export earnings rose” and “the value fell.” This would make the vocabulary more accurate and flexible.
Grammatical Range and Accuracy: Band 5.5
You attempt a mix of simple and complex sentences, including clauses introduced by “while” and “although”-type contrasts, and the main trends remain understandable. Some grammatical errors, however, recur and occasionally make relationships between figures less clear. For example, “while table illustrates” is missing an article, and “there was considerable increased” uses an incorrect form after “considerable.” In “from 44 billion dollars to approximately 40 billion dollars in single years,” the sentence lacks a clear main verb and has an incorrect article pattern. There are also agreement and punctuation problems, including “products were quite same” and the lower-case “secondly” after a full stop. Check sentence completeness, articles, verb forms, and sentence-initial capitalization; these corrections would improve accuracy while preserving your range.
See this exact question answered at other band scores. The same prompt compared across bands.
Browse more IELTS Writing model answers or get your own writing scored by the same AI examiner.