Band 6.0 IELTS Writing Task 1 Model Answer
Overall Band Score: 6.0 · Cambridge IELTS 14 · 2026-11-11
IELTS Writing Task 1 question
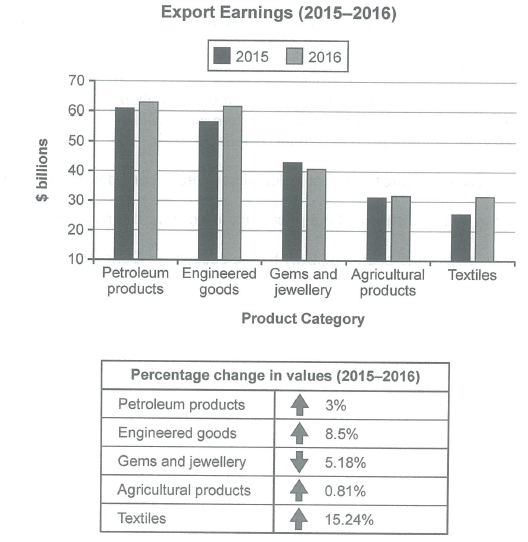
The chart below shows the value of one country’s exports in various categories during 2015 and 2016. The table shows the percentage change in each category of exports in 2016 compared with 2015.
Summarise the information by selecting and reporting the main features, and make comparisons where relevant.
Student answer (Band 6.0)
The Bar chart represents the amount of one nation exports in different things during 2015 and 2016 and the percentage of each products change in 2016 and 2015.Overall,The largest increase is in textiles with 15.24% and the category which is decrease in this year is gems and jewellery to 5.18%.
Firstly, we can see that the petroleum products are on the highest exports in 2015 with 61 billion$ and in 2016 it is on 63 billion$ but the percentage change in value is 3% increased after that, the engineered goods are on second with 57 billion$ in 2015 but in 2016 it is on 62 billion$ the percentage increased in the value is 8.5% laterly the gems and jewellery in 2015 shows the earning of 43 billion$ in 2015 on the other hand in 2016 it is on 41 billion$ and the value of percentage change in it decrease to 5.18% next, agricultural products earn arround 31 billion$ in 2015 and in 2016 it is increase to 32 billion$ a small amount of increase is in the value of percentage which is 0.81% lastly, the textile is on the lowest earning with 27 billion$ in 2015 and after that it's go higher in 2016 to 32billion$ and the value of percentage is increase to 15.24% which is higher in all categories.
AI examiner evaluation
| Criterion | Band |
|---|---|
| Task Achievement / Task Response | 6.5 |
| Coherence and Cohesion | 6.0 |
| Lexical Resource | 5.5 |
| Grammatical Range and Accuracy | 5.0 |
| Overall | 6.0 |
Task Achievement / Task Response: Band 6.5
You cover all five categories and identify the main overall pattern: textiles had the largest increase, while gems and jewellery was the only category to fall. Most figures and percentage changes are reported accurately, and the comparisons between 2015 and 2016 are relevant. This meets the task well, with some detail supporting the overview. However, the overview could be more complete by noting that petroleum products remained the highest-earning category and that agricultural exports changed very little. There are also small inconsistencies: textiles are given as 27 billion dollars in 2015, whereas the chart indicates about 26, and agricultural products are described as rising to 32 rather than about 31.5. A sharper overview and closer checking of approximate values would strengthen the response further.
Coherence and Cohesion: Band 6.0
The response follows a generally understandable order, moving from the highest-earning categories towards the lower ones, and it uses signposts such as “Firstly,” “after that,” and “lastly.” This gives the information an overall arrangement. However, nearly all the detailed comparisons are packed into one long paragraph, so the progression feels mechanical and some relationships are difficult to follow. Several transitions, including “laterly” and “next,” do not clearly show how the figures relate, while repeated “in 2015” and “in 2016” phrasing makes the account less smooth. Use a separate overview paragraph and group the detailed comparisons into shorter, logically connected sections. Clearer referencing and more varied linking would make the organisation easier to follow.
Lexical Resource: Band 5.5
You use relevant chart vocabulary, including “exports,” “percentage change,” “earning,” “increase,” and “decrease,” so the reader can understand the main comparisons. There is some attempt to vary expressions, for example “the largest increase” and “a small amount of increase.” However, word choice and collocation are often awkward: “exports in different things,” “on the highest exports,” and “the value of percentage change in it decrease” are not natural ways to describe the data. Some forms are also inaccurate, such as “engineered goods” for “engineered goods” only if intended as the chart label, and “the textile” for the category “textiles.” Aim for precise, conventional reporting phrases such as “export earnings,” “ranked second,” and “rose by.”
Grammatical Range and Accuracy: Band 5.0
The response attempts to combine comparisons and supporting details, including clauses introduced by “but” and “on the other hand.” This shows some effort to use more than simple sentence patterns. However, many sentences are long and joined with commas, and errors in verb forms, agreement, articles, and punctuation are frequent enough to make parts of the account awkward. For example, “the percentage increased in the value is 8.5%” lacks a clear grammatical structure, while “in 2016 it is increase” uses an incorrect verb form. Capitalisation after “Overall,” and sentence boundaries are also inconsistent. Build shorter, controlled sentences first, then add accurate complex clauses; check past-tense forms and subject–verb agreement when describing the completed years.
See this exact question answered at other band scores. The same prompt compared across bands.
Browse more IELTS Writing model answers or get your own writing scored by the same AI examiner.