Band 5.5 IELTS Writing Task 1 Model Answer
Overall Band Score: 5.5 · Cambridge IELTS 14 · 2026-11-12
IELTS Writing Task 1 question
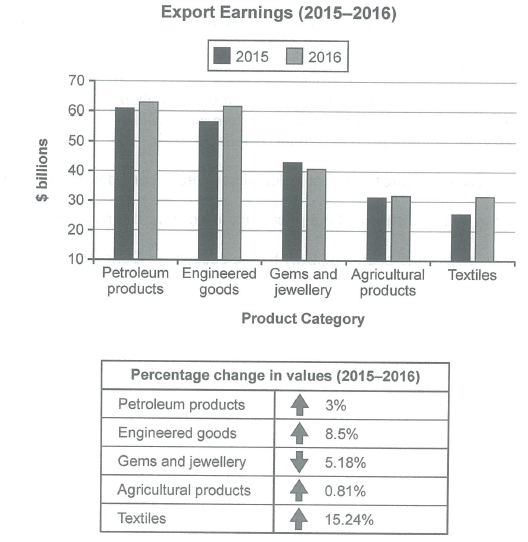
The chart below shows the value of one country’s exports in various categories during 2015 and 2016. The table shows the percentage change in each category of exports in 2016 compared with 2015.
Summarise the information by selecting and reporting the main features, and make comparisons where relevant.
Student answer (Band 5.5)
The pie chart illustrates exports in different categories in one nation, while the table present information about the category of exports in percentage in 2015 to 2016.
Overall, it is evident that petroleum products recorded the highest value. Meanwhile, textiles accounted for the greatest proportion, whereas in chart the textiles figure is compartably lower than others.
Looking first at the export earings, petroleum products recorded approximately 60 billions dollars, making it the highest figure. This was folllowed by Agriculture products, rough at 30 in both years. By comparison, textiles stood at 30 in year 2016 and in 2015 slightly lower than the 30. Over the period, Engineered good are higher than the gems jewellery.
Turning to the percentage change in values, textiles accounted for 15.24% representing the largest share. In contrast, agriculture products made up just 0.81%. The different between these categories was large proportion, highlighting engieered good and gems and jewellery are almost same. The petrolum products are at 3%.
AI examiner evaluation
| Criterion | Band |
|---|---|
| Task Achievement / Task Response | 5.0 |
| Coherence and Cohesion | 6.0 |
| Lexical Resource | 5.5 |
| Grammatical Range and Accuracy | 5.5 |
| Overall | 5.5 |
Task Achievement / Task Response: Band 5.0
You identify several relevant features, including petroleum products as the highest-earning category and textiles as having the largest percentage increase. However, the overview is unclear and partly contradictory: textiles did not account for the greatest export value, and saying their figure was “comparably lower than others” does not accurately summarise the chart. Some key comparisons are also missing or imprecise. For example, engineered goods rose from about $57 billion to $62 billion, while gems and jewellery fell from about $43 billion to $41 billion; the response only says the former was higher. The table discussion omits the 8.5% and 5.18% changes and incorrectly suggests engineered goods and gems had almost the same change. Select the main trends and report them accurately.
Coherence and Cohesion: Band 6.0
The response has a recognisable structure: an introduction, an overview, and separate paragraphs for the chart and table. Phrases such as “Looking first” and “Turning to” help signal the shift between data sources, and the information is generally grouped by topic. However, progression within paragraphs is sometimes difficult to follow because comparisons are incomplete or loosely connected. For instance, “The different between these categories was large proportion” does not clearly explain which figures are being compared, and the following reference to engineered goods and gems is not well linked to that point. Make each paragraph follow a clear comparison pattern, and use linking phrases only when the relationship between the figures is explicit.
Lexical Resource: Band 5.5
You use some appropriate chart vocabulary, including “recorded,” “approximately,” “by comparison,” and “percentage change,” which helps communicate the subject. There is also an attempt to vary wording rather than repeat “value” throughout. However, inaccurate word choices and spelling errors reduce precision: “pie chart” misidentifies the visual, “share” suggests proportions rather than export values, and “earings,” “folllowed,” “engieered,” and “petrolum” are misspelled. Some phrases are also unnatural, such as “the different between these categories was large proportion.” Use standard terms such as “bar chart,” “export earnings,” and “increase,” and check spelling and collocations so the data descriptions sound clear and precise.
Grammatical Range and Accuracy: Band 5.5
You attempt both simple and more developed sentence forms, including “Meanwhile, textiles accounted for…” and “This was followed by…”. The overall meaning is usually recoverable, but some grammatical errors remain. In the opening, “the table present information” has subject–verb disagreement, and “in percentage in 2015 to 2016” uses an unclear grammatical pattern. There are also problems with number and sentence construction in “approximately 60 billions dollars” and “agriculture products made up just 0.81%.” The sentence beginning “The different between these categories…” is difficult to parse. Practise accurate singular/plural forms, articles, and complete comparison sentences; for example, state that values “increased by” or “fell by” a percentage.
See this exact question answered at other band scores. The same prompt compared across bands.
Browse more IELTS Writing model answers or get your own writing scored by the same AI examiner.