Band 5.0 IELTS Writing Task 1 Model Answer
Overall Band Score: 5.0 · Cambridge IELTS 14 · 2026-11-13
IELTS Writing Task 1 question
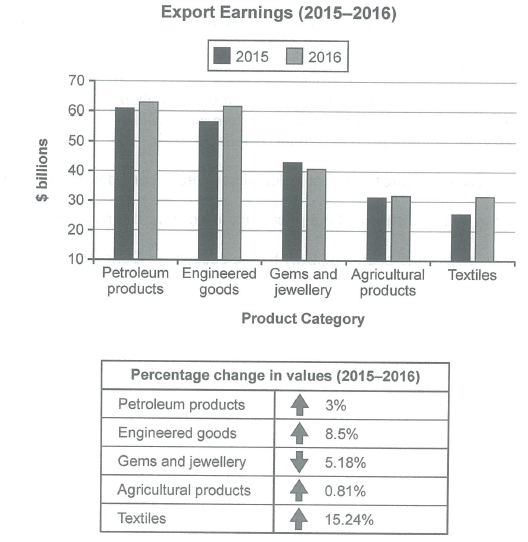
The chart below shows the value of one country’s exports in various categories during 2015 and 2016. The table shows the percentage change in each category of exports in 2016 compared with 2015.
Summarise the information by selecting and reporting the main features, and make comparisons where relevant.
Student answer (Band 5.0)
The given chart provides information about value of cpuntries in different categories during 2015 and 2016. Mpreever The tabe percentage change in every category of exports 2016 as compared to 2015.
Overall it is clear that petroleum products recorded highest figure earning. Wherease textile category had lowest product in the chart. Petroleum change in value 2015 to 2016 is 3 % also textiles change percentage is 15.24%. It is also noticeable that there where significant difference between the figures.
Looking at the details petroleum producs recorded highest revenue 60 billion in 2015 and 62 billiond in 2016. In 2015 engineered goods products earned 56 billions also 62 in 2016. Gems and jewellery 43 billions in 2015 41 billions in 2016.
In adittion the agriculture products category almost reamins constant with the differnce of 01 billions. furthermore textile are in lowest figure in these categories they eraned 25 billions in 2015 and 31 billions in 2016.
in 2015to 2016 petroleum products has lowest change in the given period with 03%.morever textiles highet percentage 15.24 in
AI examiner evaluation
| Criterion | Band |
|---|---|
| Task Achievement / Task Response | 5.5 |
| Coherence and Cohesion | 5.0 |
| Lexical Resource | 5.0 |
| Grammatical Range and Accuracy | 4.5 |
| Overall | 5.0 |
Task Achievement / Task Response: Band 5.5
You identify the main overall pattern: petroleum products are the largest export category, textiles show the strongest growth, and gems and jewellery decline. You also include figures for all five categories, so the response is relevant to the chart and table. However, some details are inaccurate: textiles were the lowest category in 2015, but in 2016 they were approximately level with agricultural products, not clearly the lowest. The petroleum figures are also slightly understated, and the agricultural change is described as about one billion rather than roughly 0.5 billion. The overview is present but limited, and the final comparison is unfinished. More accurate comparisons and a complete summary of the table’s changes would make the response more fully developed.
Coherence and Cohesion: Band 5.0
The response has a recognisable structure, moving from an introduction and overview to category details, and paragraph breaks help separate these functions. Some linking expressions, such as “Overall,” “Looking at the details,” and “In addition,” show an attempt to guide the reader. However, progression is weakened by repeated points: the overview says textiles had the lowest figure, and the final paragraph repeats the growth comparison without completing it. Connections between figures are often unclear because several are listed in fragments, for example, “In 2015 engineered goods products earned 56 billions also 62 in 2016.” Use complete comparative sentences and organise the table’s percentage changes alongside the relevant categories to create a clearer progression.
Lexical Resource: Band 5.0
You use some task-relevant vocabulary, including “recorded,” “revenue,” “percentage change,” and “remains constant,” which helps communicate the chart’s subject. However, the range is limited and several word choices or collocations are inaccurate, such as “value of countries” instead of export values, “highest figure earning,” and “lowest product.” Spelling errors—including “Wherease,” “adittion,” “differnce,” and “highet”—are noticeable and sometimes make reading less smooth. There is also repetition of “category,” “figure,” and “change.” Build a more precise set of chart-description phrases, such as “export earnings,” “the highest-valued category,” “rose by,” and “remained broadly stable,” and check spelling carefully.
Grammatical Range and Accuracy: Band 4.5
You attempt both simple statements and longer comparisons, and the reader can generally identify the categories and years being discussed. However, grammatical control is inconsistent, with frequent errors in sentence construction, articles, agreement, and punctuation. For example, “petroleum products recorded highest revenue” needs an article, while “textile are in lowest figure” has problems with number and sentence structure. Several comparisons are incomplete or compressed into fragments, such as “Gems and jewellery 43 billions in 2015 41 billions in 2016.” Tense and agreement also need attention in “petroleum products has lowest change.” Practise writing complete sentences with a clear subject and verb, and use consistent past-tense reporting forms such as “earned,” “rose,” and “declined.”
See this exact question answered at other band scores. The same prompt compared across bands.
Browse more IELTS Writing model answers or get your own writing scored by the same AI examiner.