Band 5.0 IELTS Writing Task 1 Model Answer
Overall Band Score: 5.0 · Cambridge IELTS 14 · 2026-11-13
IELTS Writing Task 1 question
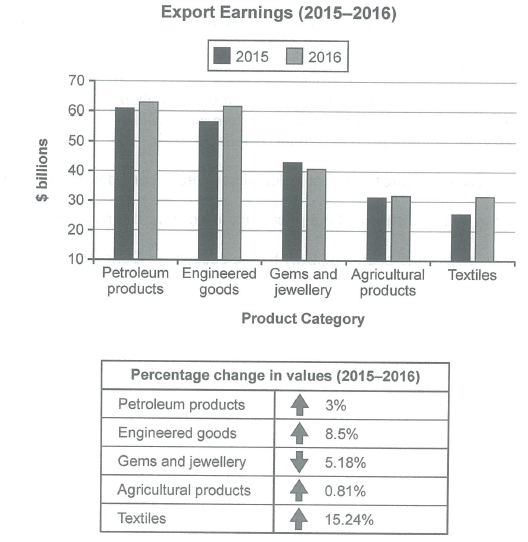
The chart below shows the value of one country’s exports in various categories during 2015 and 2016. The table shows the percentage change in each category of exports in 2016 compared with 2015.
Summarise the information by selecting and reporting the main features, and make comparisons where relevant.
Student answer (Band 5.0)
The chart illustrates the value of exports of a country in various categories during 2015 and 2016 and a chart provides the information of change in each category of exports in 2016 compared with 2015.
The chart contain different product like Gems and jewellery, Taxtiles, Agricultural products, and Petroleum products. There is also includes Engineered goods. The chart talk about the Exports earnings in 2015 and 2016 and on the other hand the table describes the product category.
The earnings of Engineered goods and Petroleum products in 2016 are almost the same, but the earnings of the same products in the same years are different. The chart shows that the Export earnings of the all products in 2015 is below the export earnings in 2016, but in the category of Gems and jewellery the trend is opposite. In the category of agricultural products earnings in both years are nearly equal at 30 billions dollars.
The table gives the idea that how much change in each category in 2015 and 2016. Taxtile products are at the highest point 15.24%in all other categories and the agricultural products are at lowest point at 0.81%. All the products show the positive response meanwhile, the gems and jewellery shows the negative trend.
AI examiner evaluation
| Criterion | Band |
|---|---|
| Task Achievement / Task Response | 5.5 |
| Coherence and Cohesion | 5.0 |
| Lexical Resource | 5.0 |
| Grammatical Range and Accuracy | 5.0 |
| Overall | 5.0 |
Task Achievement / Task Response: Band 5.5
You identify the two years and the main categories, and you report several relevant comparisons: petroleum and engineered goods are the highest earners, agricultural exports are nearly unchanged, and gems and jewellery decline. You also correctly identify textiles as having the largest percentage rise and gems and jewellery as the only category to fall. However, the overview is not sufficiently clear or accurate: “all products in 2015 is below” 2016 is contradicted by the gems figures, and the statement that petroleum and engineered goods are “almost the same” does not explain their separate values or changes. The table is described generally rather than linked to specific figures. A clearer overview and more precise comparisons would make the response more complete.
Coherence and Cohesion: Band 5.0
The response has a basic paragraph structure, moving from an introduction to chart description and then to the table, so the reader can identify the broad subject of each section. However, progression between ideas is limited, and some paragraphs do not fulfil a clear reporting purpose. For example, the second paragraph lists categories but adds little information, while “The chart shows…” and “The table gives the idea…” introduce broad statements rather than a well-organised comparison. Linking phrases such as “on the other hand” are not always used to express a meaningful contrast. Group the main trends together—for example, the highest earners, the declining category, and the relatively stable categories—and use clear references to connect the chart and table.
Lexical Resource: Band 5.0
You use some relevant task vocabulary, including “export earnings,” “category,” “positive,” and “negative trend,” and the reader can generally understand the intended comparisons. However, the range is limited and several word choices or collocations are inaccurate or repetitive. “The chart talk about” and “at the highest point” are not natural ways to describe data, while “positive response” is vague for an increase in export value. There are also spelling errors in “Taxtiles” and “Taxtile,” and repeated use of “products” where “exports” or “categories” would be more precise. Build a small set of accurate chart-reporting expressions, such as “rose by,” “recorded the largest increase,” and “remained broadly stable,” and check spelling carefully.
Grammatical Range and Accuracy: Band 5.0
You attempt both simple and more complex sentences, including a contrast with “but” and a clause beginning “meanwhile,” but control is inconsistent. Errors in agreement and verb forms appear in “The chart contain” and “The chart shows that … earnings … is below,” and the sentence “There is also includes Engineered goods” has a faulty structure. Articles and plural forms are also problematic in phrases such as “the all products” and “30 billions dollars.” These errors sometimes make the relationships between ideas harder to follow, although the general meaning is usually recoverable. Practise accurate subject–verb agreement, countable plurals, and sentence patterns for describing comparisons; then proofread each sentence for a complete and correctly formed clause.
See this exact question answered at other band scores. The same prompt compared across bands.
Browse more IELTS Writing model answers or get your own writing scored by the same AI examiner.