Band 5.0 IELTS Writing Task 1 Model Answer
Overall Band Score: 5.0 · Cambridge IELTS 14 · 2026-11-13
IELTS Writing Task 1 question
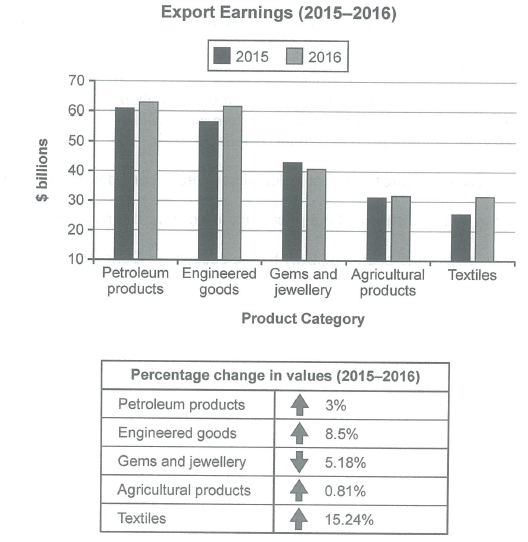
The chart below shows the value of one country’s exports in various categories during 2015 and 2016. The table shows the percentage change in each category of exports in 2016 compared with 2015.
Summarise the information by selecting and reporting the main features, and make comparisons where relevant.
Student answer (Band 5.0)
The line chart below repersen how much a countory is exporting in various categories during 2015 and 2016. The table below repersent the change in the percentage of each category of exports in 2016 compared with 2015.
Overall, the highet country’s exports during both the years 2015 and 2016 comes from petroleum products. Furthermore, the table largest increase is in taxities and there is only one dicrease in the persentage which is in gems and jewllery.
In the line chat the textiles was the lowest during both the years, in the year 2016 it was a bit over 30 bilions and in the year 2015 it was in between 20 and 30 60 bilions. Furthermore, the secound hights is for the engineered goods at at the year 2016 is was a bit over 60 bilions and at the year 2015 it was in between 50 and 60 60 bilions.
In the secound table the secound highets is engineered goods with was 8.5%. However, the lowest is in petroleum products which increase by 3%.
AI examiner evaluation
| Criterion | Band |
|---|---|
| Task Achievement / Task Response | 5.0 |
| Coherence and Cohesion | 5.0 |
| Lexical Resource | 5.0 |
| Grammatical Range and Accuracy | 5.0 |
| Overall | 5.0 |
Task Achievement / Task Response: Band 5.0
You identify several relevant features: petroleum products are the highest-earning category in both years, textiles show the largest percentage rise, and gems and jewellery are the only category to decline. However, the report covers the data only partially. It omits the fall in gems and jewellery and gives little account of agricultural products, while the description of textiles and engineered goods includes confusing figures: “in between 20 and 30 60 billions” does not clearly report the approximate values. The table discussion also calls petroleum’s 3% rise the lowest without comparing it clearly with the 0.81% rise in agriculture. Include a concise overview and accurately summarise the main changes across both visuals.
Coherence and Cohesion: Band 5.0
The response has a basic paragraph structure, moving from an introduction and overview to details about the chart and table. This gives the reader some organisation, and linking expressions such as “Furthermore” and “However” show an attempt to connect ideas. However, progression is limited: the chart paragraph jumps between textiles and engineered goods, and the final paragraph repeats table information without a clear comparison of all categories. Some connections are also awkward or unclear, particularly “In the secound table the secound highets is engineered goods with was 8.5%.” Group the chart figures in a consistent order, then summarise the table’s increases and decrease, using clear comparisons rather than repeated transitions.
Lexical Resource: Band 5.0
You use some task-relevant vocabulary, including “exports,” “categories,” “percentage,” “increase,” and “decrease,” so the topic is generally recognisable. However, the range is limited and several spelling errors make the report less clear, such as “reperesen,” “highet,” “taxities,” and “jewllery.” Some word combinations are also imprecise: “the table largest increase” and “the secound highets” do not express the intended comparison naturally. Use accurate terms for describing data, such as “export earnings,” “rose by,” “declined,” and “the largest increase,” and check spelling carefully. More precise vocabulary would help distinguish values from percentage changes.
Grammatical Range and Accuracy: Band 5.0
The response attempts a few longer sentences, including the overview beginning “Overall” and sentences linked with “Furthermore” and “However.” However, complex constructions are often faulty, and errors frequently make the intended meaning difficult to follow. For example, “the highest country’s exports … comes” has problems with the noun phrase and subject–verb agreement, while “the engineered goods at at the year 2016 is was” contains repeated and inconsistent verb forms. The sentence about textiles also lacks a clear grammatical structure. Build reliable simple sentences first, then add subordinate clauses only when you can control agreement, tense, articles, and word order. Proofread for repeated words and ensure each sentence has a clear subject and verb.
See this exact question answered at other band scores. The same prompt compared across bands.
Browse more IELTS Writing model answers or get your own writing scored by the same AI examiner.