Band 5.5 IELTS Writing Task 1 Model Answer
Overall Band Score: 5.5 · Cambridge IELTS 14 · 2026-11-13
IELTS Writing Task 1 question
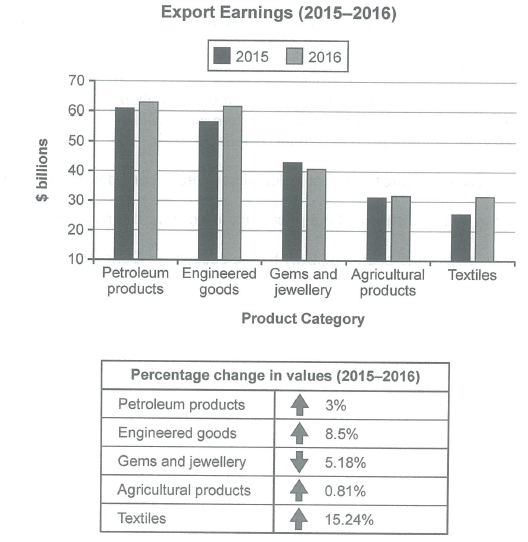
The chart below shows the value of one country’s exports in various categories during 2015 and 2016. The table shows the percentage change in each category of exports in 2016 compared with 2015.
Summarise the information by selecting and reporting the main features, and make comparisons where relevant.
Student answer (Band 5.5)
The bar graph compares a country's exportation earning in billion for five diffrent categories in 2015 ad 2016, while the table chart illustrates the percentage of each product which export in the tear 2016 and 2015.
Overall, in 2015 the figure was decline with all goods, neverthless trend was fluctuated by 2016 almost all products were export increase, but only gems and jwellery was decrease.
In 2015, the petroleum products had highest praportion at more than 60 billion, whereas the engineered goods was roughly 65 billion and, gems and jwellery at nearly half billion. Both agriculture products and textiles at lowest 32 billion and a quater. By 2016, the petroleum products and engineered goods was increse. Moreover, agriculture products was remain stable, while textile rose with around 6 billion.
Furthermore, textiles were highly surged with 15.24%, follow up petroleum and engineered goods both increase 11.5%. However, gems and jwellery was opposite trend it declines at 5.18%.
AI examiner evaluation
| Criterion | Band |
|---|---|
| Task Achievement / Task Response | 5.5 |
| Coherence and Cohesion | 6.0 |
| Lexical Resource | 5.5 |
| Grammatical Range and Accuracy | 5.0 |
| Overall | 5.5 |
Task Achievement / Task Response: Band 5.5
You identify the main categories and give an overview that most exports rose while gems and jewellery fell, which captures the broad pattern. However, several figures and comparisons are inaccurate or unclear: engineered goods were about $57 billion in 2015, not roughly $65 billion, and gems and jewellery were about $43 billion, not “nearly half billion.” The claim that both agriculture and textiles were at the lowest level also overlooks that textiles were lower than agriculture in 2015. In the table discussion, you report 11.5% growth for petroleum and engineered goods, whereas the figures are 3% and 8.5%. Select the key highs, lows and changes accurately, and make the overview more precise.
Coherence and Cohesion: Band 6.0
The response has a recognisable structure: an introduction, an overview, and paragraphs describing the chart and percentage changes. This gives the reader a coherent overall route through the information. Linking expressions such as “Overall,” “By 2016,” and “However” help signal comparisons. At times, though, the progression is weakened by unclear or contradictory statements, including “in 2015 the figure was decline with all goods” and the description of the lowest categories. Some transitions, such as “Furthermore,” do not clearly show how the table information relates to the preceding chart details. Group the main comparisons more systematically and use linking phrases to express the exact relationship between the figures.
Lexical Resource: Band 5.5
You use some task-relevant vocabulary, including “export,” “percentage,” “stable,” “rose,” and “declines,” and you attempt more descriptive terms such as “surged.” However, word choice and collocation are often inaccurate, sometimes making the meaning difficult to follow: “exportation earning,” “the percentage of each product which export,” and “follow up petroleum” are not natural expressions. Several spelling errors, including “diffrent,” “jwellery,” and “increse,” also reduce clarity. Use standard chart language such as “export earnings,” “the value of exports,” and “increased by,” and check spelling carefully. More precise vocabulary would help you describe changes without relying on vague or awkward phrases.
Grammatical Range and Accuracy: Band 5.0
You attempt a mixture of simple and longer sentences, including contrast clauses with “whereas” and “while,” and the overall meaning can usually be followed. However, errors in verb forms, agreement, articles and sentence construction are frequent enough to make some statements difficult to interpret. For example, “the figure was decline” needs a correctly formed verb, while “the petroleum products and engineered goods was increse” has both agreement and verb-form problems. In “agriculture products was remain stable,” the verb pattern is also faulty. Practise forming accurate past-tense comparisons and checking subject–verb agreement; shorter, well-controlled sentences would improve clarity before you add more complex structures.
See this exact question answered at other band scores. The same prompt compared across bands.
Browse more IELTS Writing model answers or get your own writing scored by the same AI examiner.