Band 4.5 IELTS Writing Task 1 Model Answer
Overall Band Score: 4.5 · Cambridge IELTS 14 · 2026-11-14
IELTS Writing Task 1 question
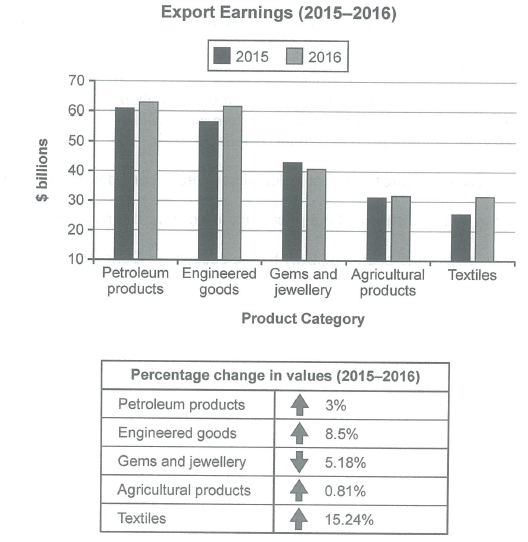
The chart below shows the value of one country’s exports in various categories during 2015 and 2016. The table shows the percentage change in each category of exports in 2016 compared with 2015.
Summarise the information by selecting and reporting the main features, and make comparisons where relevant.
Student answer (Band 4.5)
The given bar graph show information about the chart below illustrates the value of one countries exports in various categories during 2015 and 2016. The table shows the percentage change in each categoury of exports in2016 compared with 2015.The compares differents categories and percents the data in number or percentage.Over all it is clear that their are difference noticable among the categories and show in number or export eerning 2015 to 2016.The product category in petroleum products in 2015 in 60 billions and 2016 in 60 billions to increase the petroleum products in value in 2015 to 2016 in petroleum products in 3% rise The engineered goods in 2015 in 60 millions to decrease and 2016 in 60 millions to grow the the change value engineered goods in 8.5% increase. The gemsand jewellery in2015 in 40 millions to increase and 2016 in 40 millions the change vilue s in gems and jewellery 5.18% decrease. The agricultural products 2015 in 30 millions in 2016 in 30 millione to grow the agricultureal products 0.82% rise. the textiles in 2015 in 20 millions to grow in 4026 in 30 millins to increase. The textiles 15.24% increase.
AI examiner evaluation
| Criterion | Band |
|---|---|
| Task Achievement / Task Response | 5.0 |
| Coherence and Cohesion | 4.0 |
| Lexical Resource | 4.5 |
| Grammatical Range and Accuracy | 4.5 |
| Overall | 4.5 |
Task Achievement / Task Response: Band 5.0
You identify the chart’s subject and report several relevant category trends, including the rise in textiles and the fall in gems and jewellery. However, the response only partially summarises the main features: it gives no clear, accurate overview of the overall ranking or the contrast between the strongest and weakest changes. Several figures are misreported or unclear: petroleum and engineered goods are described as being worth “60 billions,” while the chart shows approximately 61 and 57 in 2015 and 63 and 62 in 2016; the textiles figures are also confused. The table’s percentage changes are mostly included, although agricultural products are given as 0.82% rather than 0.81%. Focus on the main comparisons and report values consistently in billions.
Coherence and Cohesion: Band 4.0
The response follows the categories in roughly the same order as the visual, and this gives the reader some sense of progression. However, ideas are not arranged into clear paragraphs, and the opening repeats the task description rather than establishing a concise overview. Most of the report then consists of a long sequence of similar statements beginning with “The…”, with few effective links between comparisons. Some sentences are difficult to follow because several figures and trends are packed together, as in the description of engineered goods. Use a short introduction, a distinct overview, and grouped detail paragraphs; connect categories by meaningful contrasts rather than repeating the same sentence pattern.
Lexical Resource: Band 4.5
You use some relevant task vocabulary, including “percentage change,” “increase,” “decrease,” and the product-category names, so the topic is generally recognisable. However, the range is limited and several spelling and word-choice errors make the report less clear, such as “categoury,” “percents,” “eerning,” and “vilue.” Phrases such as “the change value … 5.18% decrease” are not natural ways to describe the table, and “60 millions” uses an unsuitable unit expression. Aim for accurate, conventional chart language, for example “export earnings,” “rose by,” and “fell by,” and check spelling and collocations before finishing.
Grammatical Range and Accuracy: Band 4.5
The response attempts to report changes across two years, but sentence structures are very limited and many clauses are incomplete or inaccurately formed. For example, “The product category in petroleum products in 2015 in 60 billions” lacks a clear verb, while “The engineered goods in 2015 in 60 millions to decrease” does not form a complete sentence. Subject–verb agreement is also problematic in “The given bar graph show,” and the repeated use of “in” makes relationships between values unclear. Use complete sentences with a clear subject and verb, such as “Petroleum exports rose from about $61 billion to $63 billion.” Vary sentence forms carefully and check articles, agreement, and punctuation.
See this exact question answered at other band scores. The same prompt compared across bands.
Browse more IELTS Writing model answers or get your own writing scored by the same AI examiner.