Band 5.0 IELTS Writing Task 1 Model Answer
Overall Band Score: 5.0 · Cambridge IELTS 14 · 2026-11-14
IELTS Writing Task 1 question
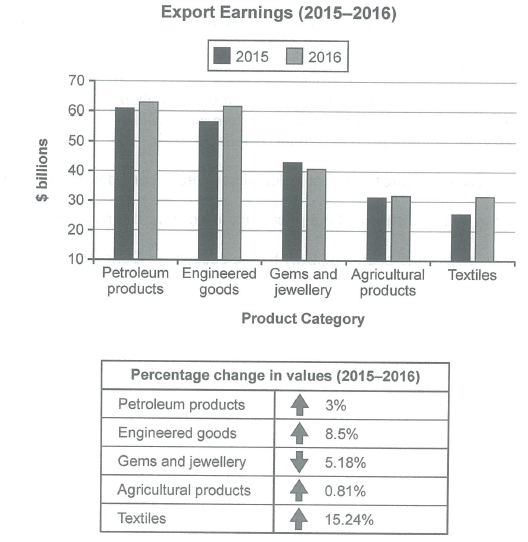
The chart below shows the value of one country’s exports in various categories during 2015 and 2016. The table shows the percentage change in each category of exports in 2016 compared with 2015.
Summarise the information by selecting and reporting the main features, and make comparisons where relevant.
Student answer (Band 5.0)
The graph illustrate the quantity of a country exports in different categories in between 2015 and 2016 . The graph also gives the information according to the percentage difference in every category of exports in 2016 compared with 2015.
Overall, in the graph the country export the petroleum in 2016 was the top of other exporting material while that country export textiles in 2015 was the lowest export done by that country .
Firstly, the petroleum and engineered categories was the large number in exportising materials ,where in 2016 the petroleum and engineered categeries have approximately the same percentage of about 62% while their percentage was different in 2015 beacuse the percentage petroleum expoting is a little bit higher than that of engineered category on the other hand gems,agricultural and textiles have very low exporting percentage . In comparision to the agricultural and textile gems had a greater percentage which is aboout 42% in 2015 and in 2016 its percentage reduce and come to 40%approximately .Agricultural exporting percentage in both years are approximatel same . While the percentage of textile in exporting have some fluctuation and their percentage are higher in
AI examiner evaluation
| Criterion | Band |
|---|---|
| Task Achievement / Task Response | 5.0 |
| Coherence and Cohesion | 5.0 |
| Lexical Resource | 5.0 |
| Grammatical Range and Accuracy | 5.0 |
| Overall | 5.0 |
Task Achievement / Task Response: Band 5.0
You identify the main categories and make a useful attempt at an overview by noting that petroleum was the leading export in 2016 and textiles were lowest in 2015. However, the overview is incomplete and some comparisons are inaccurate or unclear. The chart gives export values in billions of dollars, not percentages: for example, petroleum and engineered goods were about $63bn and $62bn in 2016. You also describe gems as falling to about $40bn, which is close to the chart, but do not clearly report the substantial rise in textiles or the small changes in agricultural exports. The final sentence is unfinished, and the table’s percentage changes are not accurately summarised. Select the main rises and fall, and support them with clear figures.
Coherence and Cohesion: Band 5.0
The response has a basic structure, beginning with an introduction and an overview before moving to category comparisons. This gives the reader some sense of organisation. However, progression is difficult to follow because several categories are combined in long sentences, and links such as “on the other hand” do not clearly signal the relationship between the information. The discussion shifts from petroleum and engineered goods to three other categories without a clear comparison pattern. The final phrase, “their percentage are higher in”, leaves the response incomplete and disrupts the flow. Use separate paragraphs for the overview and detailed comparisons, then group the categories by trend—for example, rising exports, falling gems, and nearly stable agriculture—with clear referencing and transitions.
Lexical Resource: Band 5.0
You use some relevant task vocabulary, including “categories,” “percentage difference,” “approximately,” and “compared with,” so the topic is generally recognisable. However, the range is limited and several inaccurate or repeated expressions make the data harder to interpret. “Exportising materials” and “exporting percentage” are not natural ways to describe the figures; use “export earnings” or “export value.” The chart reports monetary values, so repeatedly calling them “percentages” is also imprecise. There are noticeable spelling errors, including “categeries,” “beacuse,” “comparision,” and “aboout.” Aim for accurate collocations and use the units consistently: describe values in billions of dollars, reserving percentages for the table’s year-on-year changes.
Grammatical Range and Accuracy: Band 5.0
You attempt to connect ideas in longer sentences, using forms such as “while” and “on the other hand,” but these complex constructions are often faulty, and errors frequently make relationships unclear. For example, “the graph illustrate” has subject–verb disagreement, while “the petroleum and engineered categories was” also needs a plural verb. Articles and sentence structure are problematic in “the country export the petroleum in 2016 was the top,” and the final sentence is incomplete. Punctuation is also inconsistent, with missing spaces after commas and a space before the full stop in the opening sentence. Practise building accurate short sentences first, then combine them with subordinate clauses while checking agreement, tense, and sentence completion.
See this exact question answered at other band scores. The same prompt compared across bands.
Browse more IELTS Writing model answers or get your own writing scored by the same AI examiner.