Band 6.0 IELTS Writing Task 1 Model Answer
Overall Band Score: 6.0 · Cambridge IELTS 14 · 2026-11-15
IELTS Writing Task 1 question
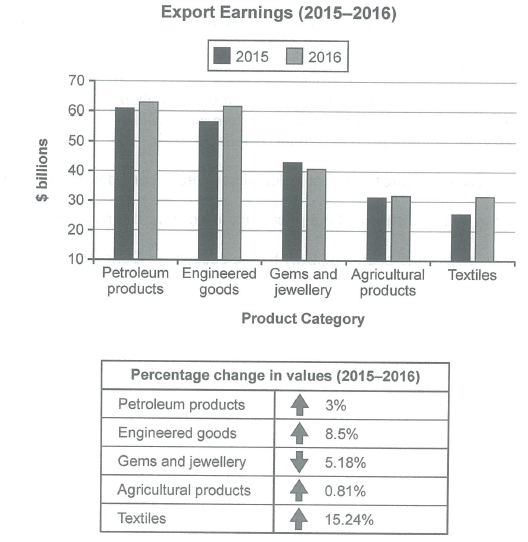
The chart below shows the value of one country’s exports in various categories during 2015 and 2016. The table shows the percentage change in each category of exports in 2016 compared with 2015.
Summarise the information by selecting and reporting the main features, and make comparisons where relevant.
Student answer (Band 6.0)
The bar chart demonstrates the value of one country exports in various categories from 2015 to 2016 and the table illustrates the proportion change in each category in 2016 compared with 2015 year.
Overall it is clear that earning increased in 2016 year in most of the categories, while Gems and Jewellery was the only category that fell in 2016 . In table, textile had increased their highest value and agricultural products change their value very lower.
In terms of earnings, Petroleum products 61$ billions in 2016 which was compared with 60$ billions in 2015. Engineered goods 61$ billions in 2016 followed by 58$ billions in 2015. Moreover, Gems and Jewellery was the only category where trend reversed 41$ billions in 2015 and 40$ billions in 2016. Agricultural products where both have same ratio at just 31$ billions. Finally, the last group, textiles 31$ billions in 2016 and 28$ billions in 2015.
Regarding the percentage change, textile saw the highest increased at 15.24% which was followed by Engineered goods and Gems and jewellery accounted at 8.5% and 5.18% respectively. Furthermore, Petroleum products changed at just 3%. The lower category was agricultural products at just 0.81%.
AI examiner evaluation
| Criterion | Band |
|---|---|
| Task Achievement / Task Response | 6.0 |
| Coherence and Cohesion | 6.5 |
| Lexical Resource | 5.5 |
| Grammatical Range and Accuracy | 5.5 |
| Overall | 6.0 |
Task Achievement / Task Response: Band 6.0
You identify the main overall pattern: most export categories rose, while gems and jewellery declined, and you note textiles’ strongest percentage growth and agriculture’s smallest. These are relevant features and give the report a clear overview. However, several figures and comparisons are inaccurate: petroleum is about $61 billion in 2015 and $63 billion in 2016, not the reverse; engineered goods are about $57 billion and $62 billion, rather than $58 billion and $61 billion; and gems fell from about $43 billion to $41 billion, not from $41 billion to $40 billion. The table’s 5.18% for gems is a decrease, but you describe it as an increase. More accurate reporting and clearer development of the key comparisons would make the summary more complete.
Coherence and Cohesion: Band 6.5
The response is organised into an introduction, an overview, a paragraph on export values and a final paragraph on percentage changes. This gives the reader a generally logical route through the information, and signposts such as “Overall,” “In terms of earnings” and “Regarding the percentage change” help distinguish the sections. The main progression is clear, though some links are mechanical and a few references are difficult to follow—for example, “In table” and “the last group” do not connect smoothly to the information around them. The overview also combines trends and rankings without clearly separating them. To strengthen cohesion, use more precise references to categories and connect comparisons directly, rather than relying mainly on paragraph-opening phrases.
Lexical Resource: Band 5.5
You use a relevant range of chart vocabulary, including “value,” “categories,” “percentage change,” “followed by” and “highest.” This is enough to communicate the broad trends, but several word choices and collocations are unnatural or imprecise, such as “proportion change,” “earning increased,” “trend reversed” and “the highest increased.” “Same ratio” is also not the right expression for values that remained stable. These choices sometimes make the intended comparison less clear, even though the reader can usually infer it. Aim for standard reporting phrases such as “export earnings,” “percentage change,” “declined” and “recorded the largest increase,” and check that each word accurately describes a rise, fall or unchanged figure.
Grammatical Range and Accuracy: Band 5.5
You attempt both simple and more complex sentence forms, including the overview clause beginning “while” and the comparison introduced by “which was compared with.” The paragraph structure also helps make the message understandable. However, some grammatical errors recur in sentence construction, articles, agreement and tense. For example, “one country exports” needs a possessive form, “textile had increased their highest value” has unclear agreement and verb form, and “Agricultural products where both have same ratio” is not a complete, well-formed sentence. Several data statements also omit a verb, as in “Petroleum products 61$ billions in 2016.” Use complete clauses with a consistent past tense and check articles and singular/plural agreement; this would improve accuracy while preserving your range of structures.
See this exact question answered at other band scores. The same prompt compared across bands.
Browse more IELTS Writing model answers or get your own writing scored by the same AI examiner.